Why Have Capital Cities Performed Differently Amid Covid-19?
Not every Australian housing market has performed the same way since the onset of the Covid-19 pandemic.
The latest Corelogic home value index results reveal that since March, Melbourne property values have fallen 3.5 per cent.
Meanwhile, the ACT dwelling market reached a record high.
And from June to July, the rate of decline eased across Perth from -1.1 per cent to -0.6 per cent, but deepened across Melbourne and Sydney.
The chart below shows the varied trajectories of capital city markets from the end of March.
The end of March is a good place for dating the “start” of the Covid-19 pandemic in Australia, because Australia recorded its 100th case of Covid-19 on 14 March, and 25 March saw the national rollout of stage 2 restrictions—which created much of the economic shock as business activity slowed.
Melbourne has so far seen the largest cumulative declines in property values since March (3.5 per cent), led by a 5.2 per cent decline across the Inner East region.
Cumulative dwelling market value change
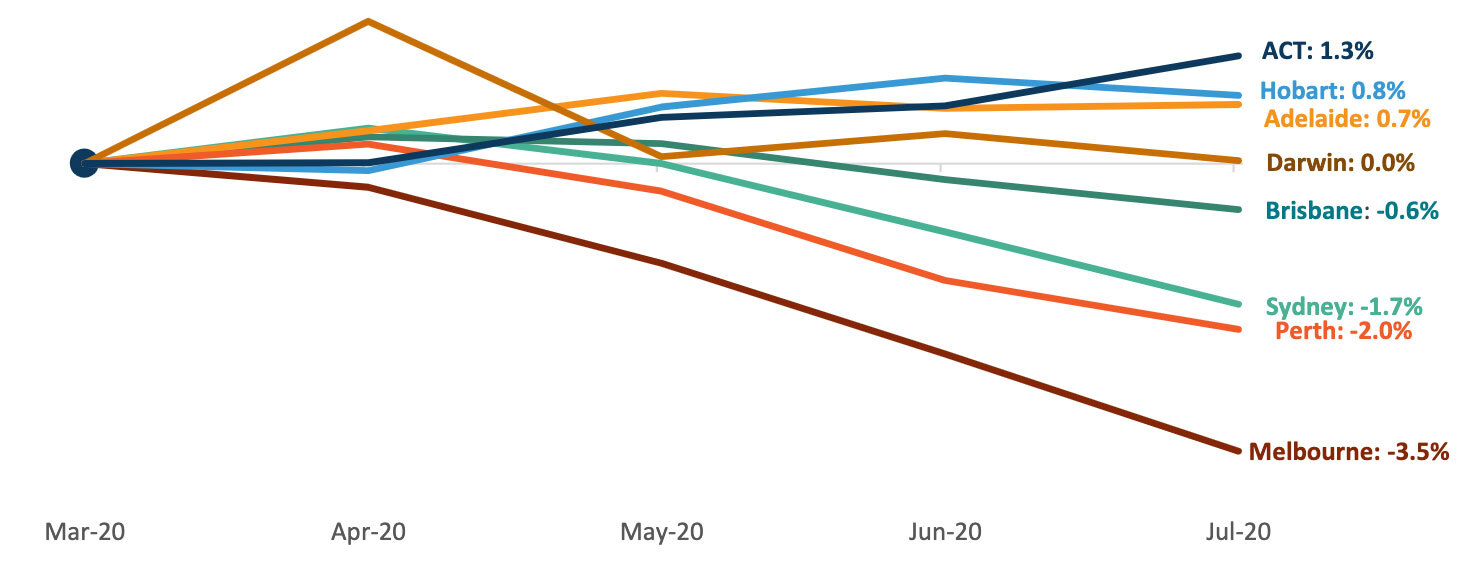
^ From 31 March to 31 July. Source: Corelogic.
As has been explored in recent weeks, the steeper decline across the Melbourne market is two-fold.
Cyclically, Melbourne property is subject to more volatile growth rates, and is also presenting strong declines off the back of very high growth rates through the previous upswing.
Structurally, there has been an enormous demand shock to the Melbourne property market with the closure of international borders, where Melbourne previously had the highest level of net overseas migration of the capital city markets.
This is similar to the Sydney housing market, which received the second highest volume of net interstate migrants over 2018-19.
Victoria has also seen the largest decline in payroll jobs of the states and territories, according to ABS data.
Conversely, the ACT has seen property value increases of 1.3 per cent since March.
While the performance of the ACT market may seem like an anomaly, the ACT dwelling market is one of the few markets performing as may be expected amid the record low cash rate setting.
RBA research has noted that reductions in the cash rate typically increase property values over time, because debt becomes cheaper and purchasing capacity increases.
However, it is still striking that 70 per cent of food and accommodation employers reported a reduction in staff hours.
Food and accommodation employs about 8 per cent of Australians, or about 1.2 million people—this is where a more granular view of employment data can highlight risks to the property market.
The detailed quarterly survey data provides insight into what industry residents work in, at the SA4 level.
The February edition suggests that most food and accommodation workers are highly concentrated in Sydney’s Inner West, followed by the Sunshine Coast and the Coffs Harbour-Grafton region.
This market has likely been buoyed by the relative stability in employment across sectors where workers are on higher incomes, and are more likely to be home owners or prospective buyers.
For example, ABS payroll data shows the number of jobs across the financial and insurance industry in the ACT has actually increased 0.7 per cent since the start of the pandemic.
A “two-tiered ”state of the labour market is highlighted by the fact the ACT accommodation and food services sector has seen the largest rate of decline of the states and territories.
This industry is more likely to be comprised of renters, and rental values have fallen half a percent across the ACT since March, with larger falls across the unit sector (-1.0 per cent).
Smaller housing markets have seen better capital growth results since March.
Adelaide is a relatively steady market that has traditionally not seen volatile movements in response to negative economic shocks: this may be partly to do with the relatively low level of investment activity across the market.
CoreLogic estimates that the portion of dwellings across Adelaide that were owned by investors as of July 2020 was 28.9 per cent, compared with 34.5 per cent nationally.
While Adelaide has seen modest growth during the pandemic, this has not traditionally been a market with strong capital growth returns.
Annualised growth across Adelaide dwellings over the past 10 years was 1.3 per cent, compared with 3.0 per cent across the combined capital cities market.
It is also worth noting that while cumulative price changes show four of the eight capital city markets haven’t declined in value since March, almost all markets are showing a slowdown in growth rates.
This suggests that, as with past downturns, most housing markets will be subject to a downswing phase.
What to expect going forward
Looking forward, there are a variety of factors that will influence the outlook for home values.
Of immediate concern is the steepening curve of the virus in Victoria, and considering that state accounts for around a quarter of the nation’s economy, the stage-four lockdown has already dampened both consumer and business sentiment nationally—and the interruption to economic activity will deepen and lengthen Australia’s recession.
Cities where labour markets are more impacted are also likely to underperform, as will those with more significant exposure to overseas migration as a source of housing demand.
As federal government fiscal support moves from around $18 billion per month to around $3 billion from October, housing market conditions will be tested more broadly, so this is when we are likely to see a rise in the number of households facing financial distress and a lift in urgent sales.
The expiry of mortgage repayment holidays is another downside factor for the market.
Pre-Covid, mortgage arrears remained around 1 per cent of the mortgage book, but with unemployment expected to reach 10 per cent—along with less fiscal support and an expectation that mortgagors taking a repayment holiday will need to face up to their debts by April next year—it’s reasonable to expect a sharp rise in mortgage arrears, which could see a lift in distressed properties hitting the market.
The RBA has previously noted for every 1 per cent rise in the unemployment rate, 90 day mortgage arrears generally increase by 80 basis points.
If unemployment rises to 10 per cent, that implies a 90-day mortgage arrears rate around 5 per cent.
Arguably, this may be an overstatement, considering weak labour market conditions are skewed to more casualised workers who tend to be renters rather than home owners.
The outlook for both the economy and housing markets remains extremely uncertain, but risk remains skewed to the downside.

Victorian Lot Costs Fall, but Developers Warned Not to Bank on it

Living on the Edge: Finding Feasibility in a Fluid Market

Off-Market Deals, Premium Pricing, Certainty: Hyperlocal Strategy Proves its Worth

Coworking Pushes Deeper into Office Market as Cubes.Co Grows


