Commercial and Retail Cranes Keep Australian Construction Steady
A noticeable drop in the number of residential cranes has been offset by their rise in commercial and retail construction use.
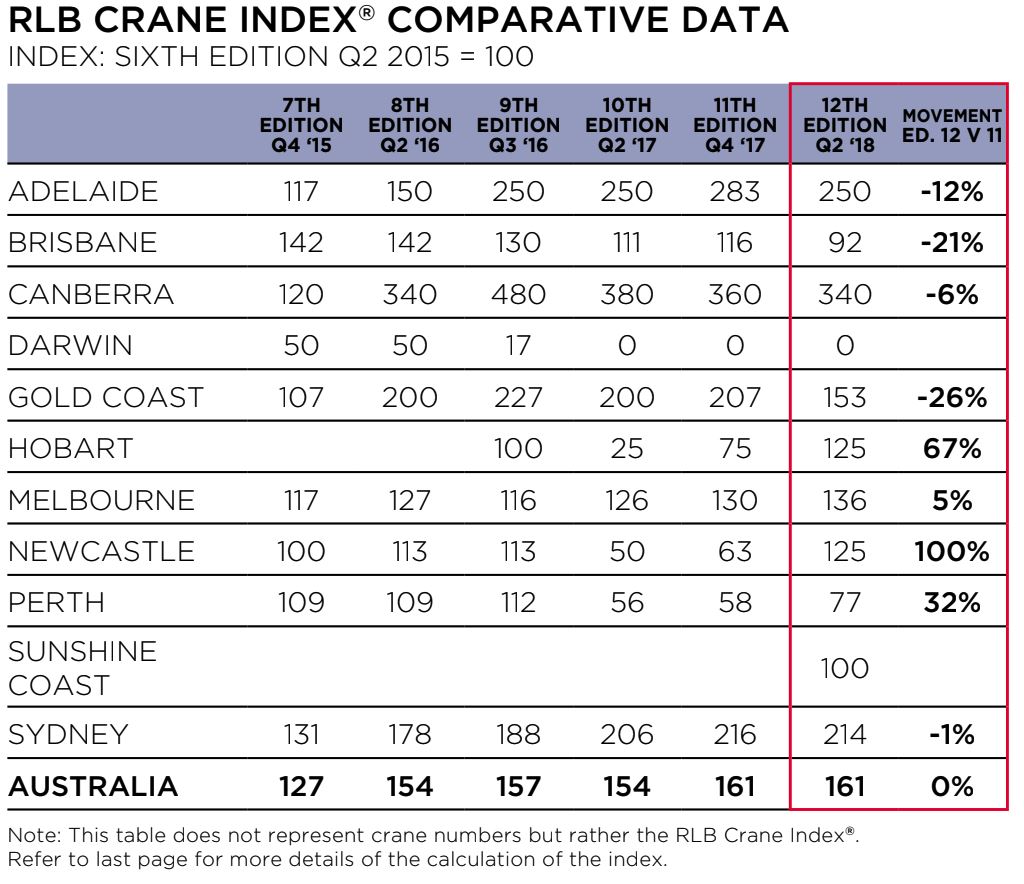
Quantity surveying firm Rider Levett Bucknall’s (RLB) Crane Index reveals Australia’s construction industry is steadily humming along, with a total of 684 cranes currently on projects across the country.
Using the number of active cranes as a yard stick to determine construction activity, the Index tracks the numbers of cranes in key Australian cities.
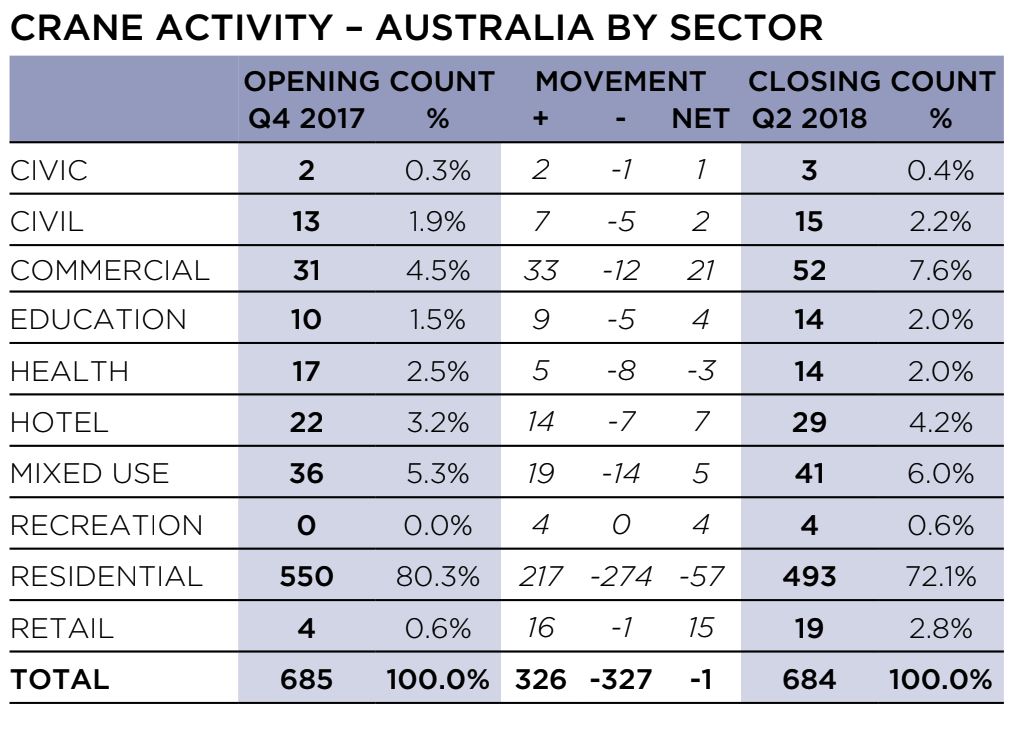
The non-residential sector index rose by 42 per cent while cranes for residential use fell by 10 per cent in RLB’s Q2 2018 count.

While a decline in the number of residential cranes has been seen across the country, RLB director of research Stephen Ballesty says this has been balanced by a rise in both the commercial and retail sector cranes.
“The report includes for the first time, cranes on developments in the Sunshine Coast in South East Queensland,” he said.
Related reading: Non-Residential Building Continues to Buoy Australia’s Construction Sector

Although the report shows a decrease of only one crane across Australia over the past six months, by excluding the Sunshine Coast’s 10 cranes, the like for like comparison is a fall of 11 cranes across the country or 1.5 per cent.”
While a decline in the number of residential cranes has been seen across the country, Ballesty says this has been balanced by a rise in both the commercial and retail sector cranes.
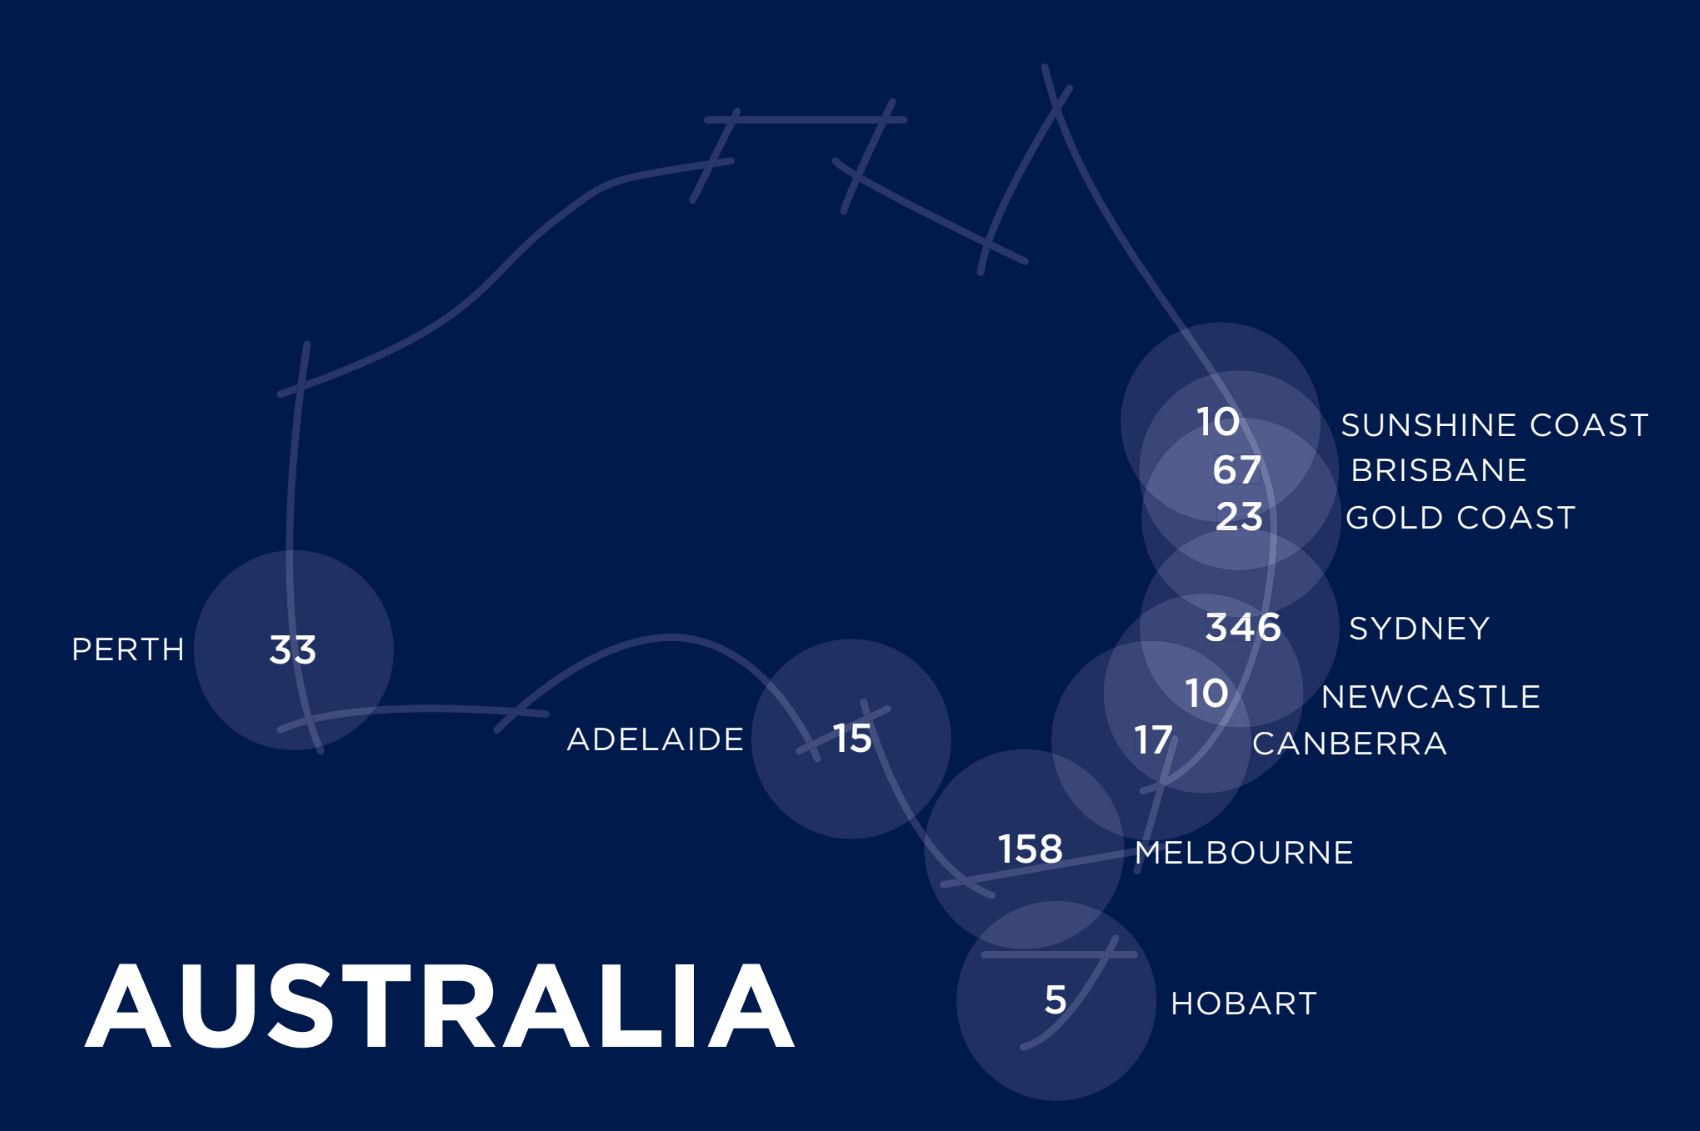
Of the 684 cranes standing across the county, more than half of those were in Sydney (346), Melbourne had 158, Brisbane was at 67, Gold Coast 23, Perth 33, Canberra had 17, while Adelaide had 15, Newcastle 10, Sunshine Coast 10, five in Hobart, and none in Darwin.
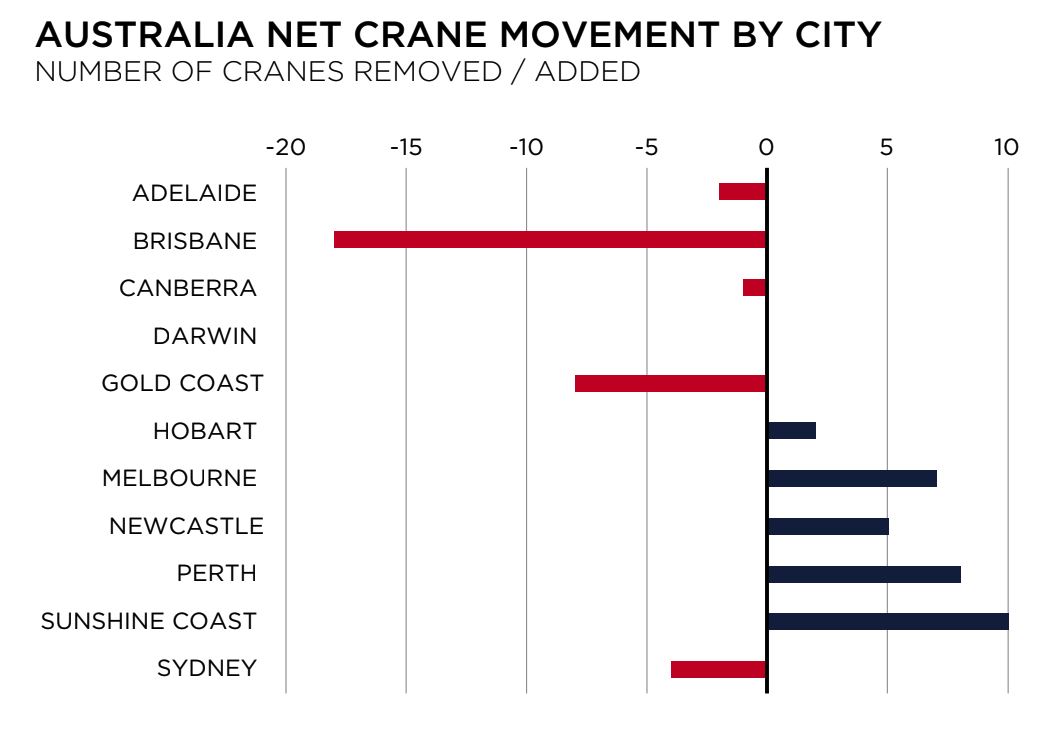
“The impact of the slowing mining sector and the large number of residential apartment completions within Brisbane has seen a 21 per cent fall in crane numbers,” Ballesty said.

Sydney’s spread
The Crane Index revealed three quarters of Australian cranes were located in Sydney and Melbourne.
With Sydney having 51 per cent of the nation’s cranes dispersed across the city – the CBD and surrounding suburbs have 34 (10 per cent) cranes, the eastern suburbs have 11 (3 per cent), the north has 98 (28 per cent), the south has 88 (25 per cent), the west has 109 (32 per cent) and the Wollongong region had six (two per cent).
“Although residential cranes fell within Sydney with 45 removals, the non-residential sector grew, offsetting these losses. A net loss of four cranes within Sydney is the first fall since the commencement of the Index,” Ballesty said.
Brisbane was harder hit by the slowdown in residential construction.

Brisbane’s residential cranes fell from 61 to 43, suffering a net loss of 18 cranes. Brisbane’s overall crane numbers dropped below 2015 levels, falling 21 per cent.
Brisbane’s recent residential apartment surge has impacted crane numbers in this index.
While the residential sector saw a loss of eighteen cranes, crane numbers remained steady in the non-residential sectors.
Related reading: 10,000 Apartments Abandoned in Saturated Brisbane Market: BIS
Taking into consideration the high apartment approval levels recorded in 2015 being a catalyst for the rise in crane numbers from 2016 to early 2017, Ballesty says it’s likely the large growth in development over the past two years has been largely completed.
“We foresee a more stable level of development for the next period to come.”


