
ResidentialEliza OwenFri 05 Mar 21
Home Prices Surge at the High End of Capital City Markets
The latest home value index results from Corelogic showed the strongest monthly rate of growth in national dwellings since August 2003.
A striking feature of the current upswing is the pace at which the "high" end of the market has risen in recent months.
The high end of a market is measured by Corelogic in its "tiered indices" series.
The high tier is the top 25 per cent of property values in any given region. As of February, this refers to dwelling values at around $960,000 or higher for the combined capitals, with a typical value in the high tier around $1.2 million.
Over February, the top 25% of values in the combined capital cities jumped 2.7 per cent in value. This was up from an increase of 0.5 per cent in January.
The high end of the market clearly led growth in values over the month. The middle 50 per cent of dwelling values (the mid-tier) increased 1.5 per cent, and the "low" end of property values (the low tier) increased 1.2 per cent.
As can be seen in the rolling quarterly growth of tiered indices across the capital cities, the uplift at the high end of the market follows a deeper downturn during the height of Covid restrictions in 2020.
Over the course of 2020, the high tiered index had a peak-to-trough decline of -4.3 per cent, compared to a -1.6 per cent fall across the middle of the market, and a -0.8 per cent fall at the low end.
Rolling quarterly growth in tiered home value indices and typical dwelling values within capital city tiers as of Feb 21
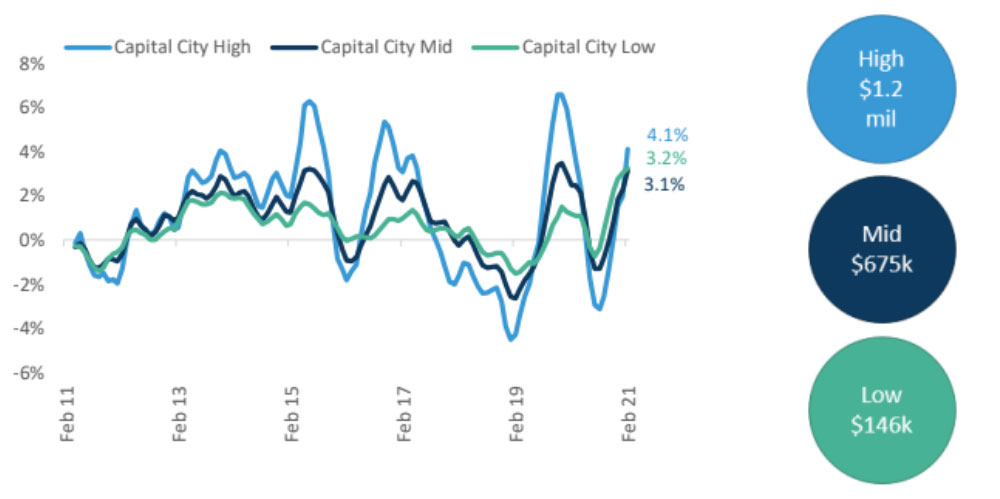
^Source: Corelogic
The low end of the market in the capital cities can be characterised by dwelling values sitting under $497,000.
Looking at the time series, the resilience at the low end of the market during the downswing tends to be a common cyclical pattern, as does the outperformance of the high end of the market during an upswing.
Buoyancy at the low end of the market during 2020 may also be due to rapid growth in the first home buyer segment over the year.
ABS data indicates the value of first home buyer lending increased 42.3 per cent in the year to January, and first home buyers typically target lower-value market segments due to affordability constraints.
As values rise in 2021, and incentives for first home buyers are tapered, the year ahead is likely to be characterised by lower levels of first home buyer participation.
Meanwhile, the current upswing in property values is already showing outperformance of the high end across the capital cities, and within many of the capital cities.
The table below shows the quarterly growth in different value segments in the capital city markets, as well as the indicative values for each value tier as of February 2021.
Dwelling market performance by value segment: GCCSA
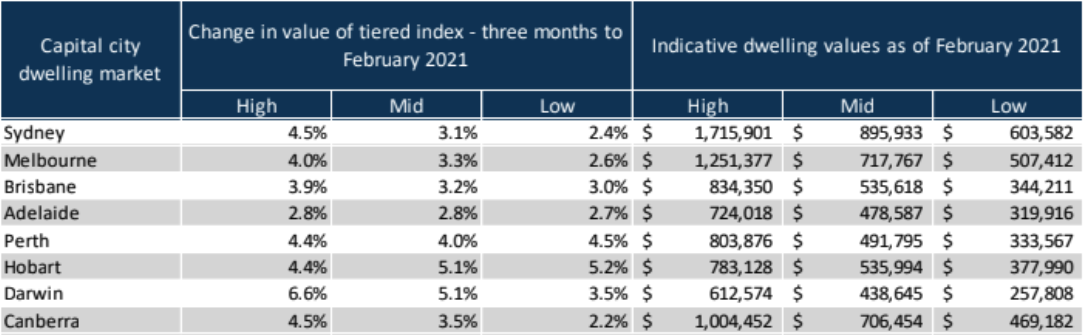
^Source: Corelogic
Of the capital city markets, the high end of values has led growth across Sydney, Melbourne, Brisbane and Canberra.
The relatively large size and value of these cities also explains why the combined capital cities index has shown a significant uplift in the high end of the market.
Melbourne and Sydney show this cyclical pattern fairly consistently, where the most expensive parts of the housing market see deeper declines in downswing periods, and higher highs during an upswing phase.
More recently, this has been reflected in the change in values across the Northern Beaches of Sydney, a relatively high-end market which increased 6.4 per cent in value in the three months to February.
This was followed by a 5.3 per cent increase across the Baulkham Hills and Hawkesbury region.
In Melbourne, the lifestyle market of the Mornington Peninsula, which proved popular during Covid-19, is still leading quarterly growth at 7.9 per cent in the three months to February.
However, growth rates have been rising across the expensive Inner East of Melbourne, which was up 2.5 per cent in the month of February.
It is important to keep perspective of the long term patterns in growth across different segments of the market.
High-end property markets may seem excessively risky during downturn periods because they tend to lose the most value in a negative economic shock.
However, what is being observed across the market at the moment is that periods of upswing deliver higher returns across the more expensive segment of the property market.
Similarly, the low end of the housing market may appear subdued while the rest of the market is booming, but holds its value relatively well during downturns.
Looking at long term annualised growth rates of values within the capital cities suggests 10 year annualised growth is fairly uniform across the different value segments.
Over the course of 2021, the middle and lower value segments of the market are likely to follow the same trend as the high end, though growth rates are not expected to be as strong.


