Which Housing Markets Are Back Above Pre-Covid Values?
Housing market data has shown a fairly strong post-Covid recovery trend following a short, sharp slowdown inactivity through the middle of 2020.
Australian housing values rose 2.3 per cent in the final quarter of the year, trending higher from a recent low in September 2020, to be just 0.1 per cent below the previous record high value in October 2017.
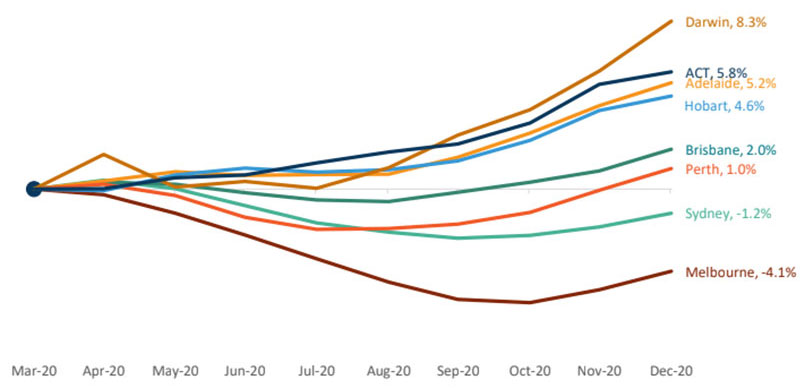
Data from Corelogic reveals which housing markets have seen the highest value increases relative to their value at March 2020.
March 2020 is a good yardstick for measuring the impact of Covid on housing markets.
That is because it encompasses the "start" of Covid in Australia, when the country reached the milestone of 100 cases diagnosed, and subsequently stage 2 restrictions rolled out nationally.
At the capital city level, Melbourne, Sydney, Perth, Brisbane and Hobart saw some level of value falls close to the onset of Covid.
By December however, Perth, Brisbane and Hobart housing values had surpassed their March 2020 highs.
Home values across Darwin, the ACT and Adelaide have continually increased since March, with Darwin values up 8.3 per cent since the onset of the pandemic.
Cumulative change in dwelling values — Mar to Dec 2020

^Source: Corelogic
The tables below contain the same data for dwelling markets within Australian capital cities at the local government area (LGA) level.
It includes markets that saw a Covid-induced decline in values, and those that did not.
Only markets with more than 500 transactions in the year were analysed.
Of the 116 LGA markets analysed, 95 saw some level of decline in values since the onset of Covid.
Of those 95 markets, 37 have recovered to value levels above March.
Change in dwelling values since March, by capital city local government area
| Council name | City | Apr 20 | Dec 20 | Was there a Covid-dip in this market? |
|---|---|---|---|---|
| Frankston | Melbourne | 0.3%▲ | -0.1%▼ | Yes |
| Stirling | Perth | 0.5%▲ | -0.1%▼ | Yes |
| Nillumbik | Melbourne | -0.1%▼ | -0.2%▼ | Yes |
| Armadale | Perth | 0.2%▲ | -0.2%▼ | Yes |
| Wyndham | Melbourne | 0.5%▲ | -0.3%▼ | Yes |
| Macedon Ranges | Melbourne | 0.2%▲ | -0.3%▼ | Yes |
| Melton | Melbourne | 0.1%▲ | -0.4%▼ | Yes |
| Canning | Perth | 0.6%▲ | -0.5%▼ | Yes |
| Hobsons Bay | Melbourne | 0.0%▲ | -0.6%▼ | Yes |
| Melville | Perth | 0.7%▲ | -0.6%▼ | Yes |
| Council name | City | Apr 20 | Dec 20 | Was there a Covid-dip in this market? |
|---|---|---|---|---|
| Monash | Melbourne | 0.0% | -5.8%▼ | Yes |
| Yarra | Melbourne | -0.6%▼ | -6.2%▼ | Yes |
| Lane Cove | Sydney | -0.5%▼ | -6.2%▼ | Yes |
| Willoughby | Sydney | -0.8%▼ | -6.3%▼ | Yes |
| Stonnington | Melbourne | -0.9%▼ | -6.6%▼ | Yes |
| Whitehorse | Melbourne | -0.1%▼ | -6.7%▼ | Yes |
| Knox | Melbourne | 0.0% | -7.1%▼ | Yes |
| Manningham | Melbourne | 0.1%▲ | -7.2%▼ | Yes |
| Port Phillip | Melbourne | -1.5%▼ | -8.2%▼ | Yes |
| Boroondara | Melbourne | -1.5%▼ | -9.7%▼ | Yes |
Some of the strongest value increases since March are located in areas that did see a Covid-induced decline including Kwinana in Perth (up 8.7 per cent), Burnside in Adelaide (up 7 per cent), and Scenic Rim in Brisbane (up 6.5 per cent).
Most of the markets with a strong recovery had seen relatively mild downturns to begin with.
A good example of this is Sydney’s Central Coast, where values declined just -0.1 per cent over April.
The Central Coast has been a resilient and popular market through much of 2020 due to the relatively affordable and low density stock across the region, as well as the coastal appeal.
Since March, dwelling values on the central coast have increased 6.5 per cent through to December.
Of the 10 council regions where values have been most impacted since the onset of the pandemic, eight were located across Melbourne, and two were in Sydney.
It is unsurprising to see Melbourne dwelling markets have a long way to go before recovering value.
Housing demand in this historically global city has been hampered by extended international border restrictions, as well as domestic social distancing policies through the September quarter.
Highlighting the depth of decline, or value increases, at a LGA level has important implications for real estate, banking and finance.
The data shows inner-Melbourne council areas may be at greater risk of negative equity for recently purchased homes.
For first home buyers or first time investors, the data also demonstrates where values are relatively discounted due to Covid-19.
However, it is worth noting that in 2021, more markets are likely to move into recovery mode.
This is expected as long as economic conditions continue to recover, and mortgage rates remain at record lows.


