Improved Housing Affordability Short Lived: Report
Despite recent news that housing affordability is improving as market conditions continue to soften, the longer-term view has seen affordability across the nation deteriorate.
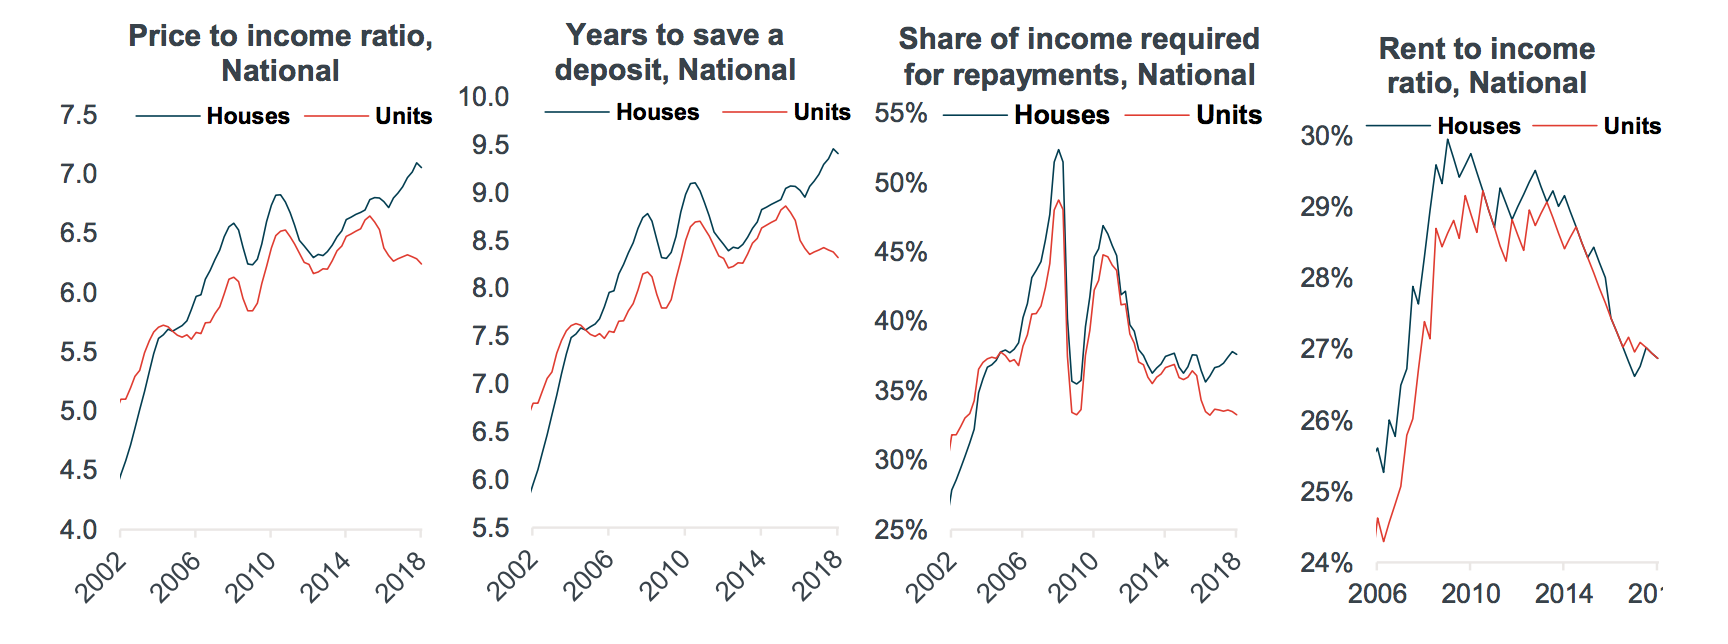
National results over the June quarter indicate that the price to income ratio is at 6.81 (dwelling prices are 6.81 times higher than gross annual household incomes) – a modest reduction from the 2018 March quarter, according to property research group Corelogic.
Across the broad dwelling types, the ratio of house prices to house incomes was recorded at 7.1 times, while the unit price to household income ratio was recorded at 6.2, well down from its 6.6 times peak in late 2015.
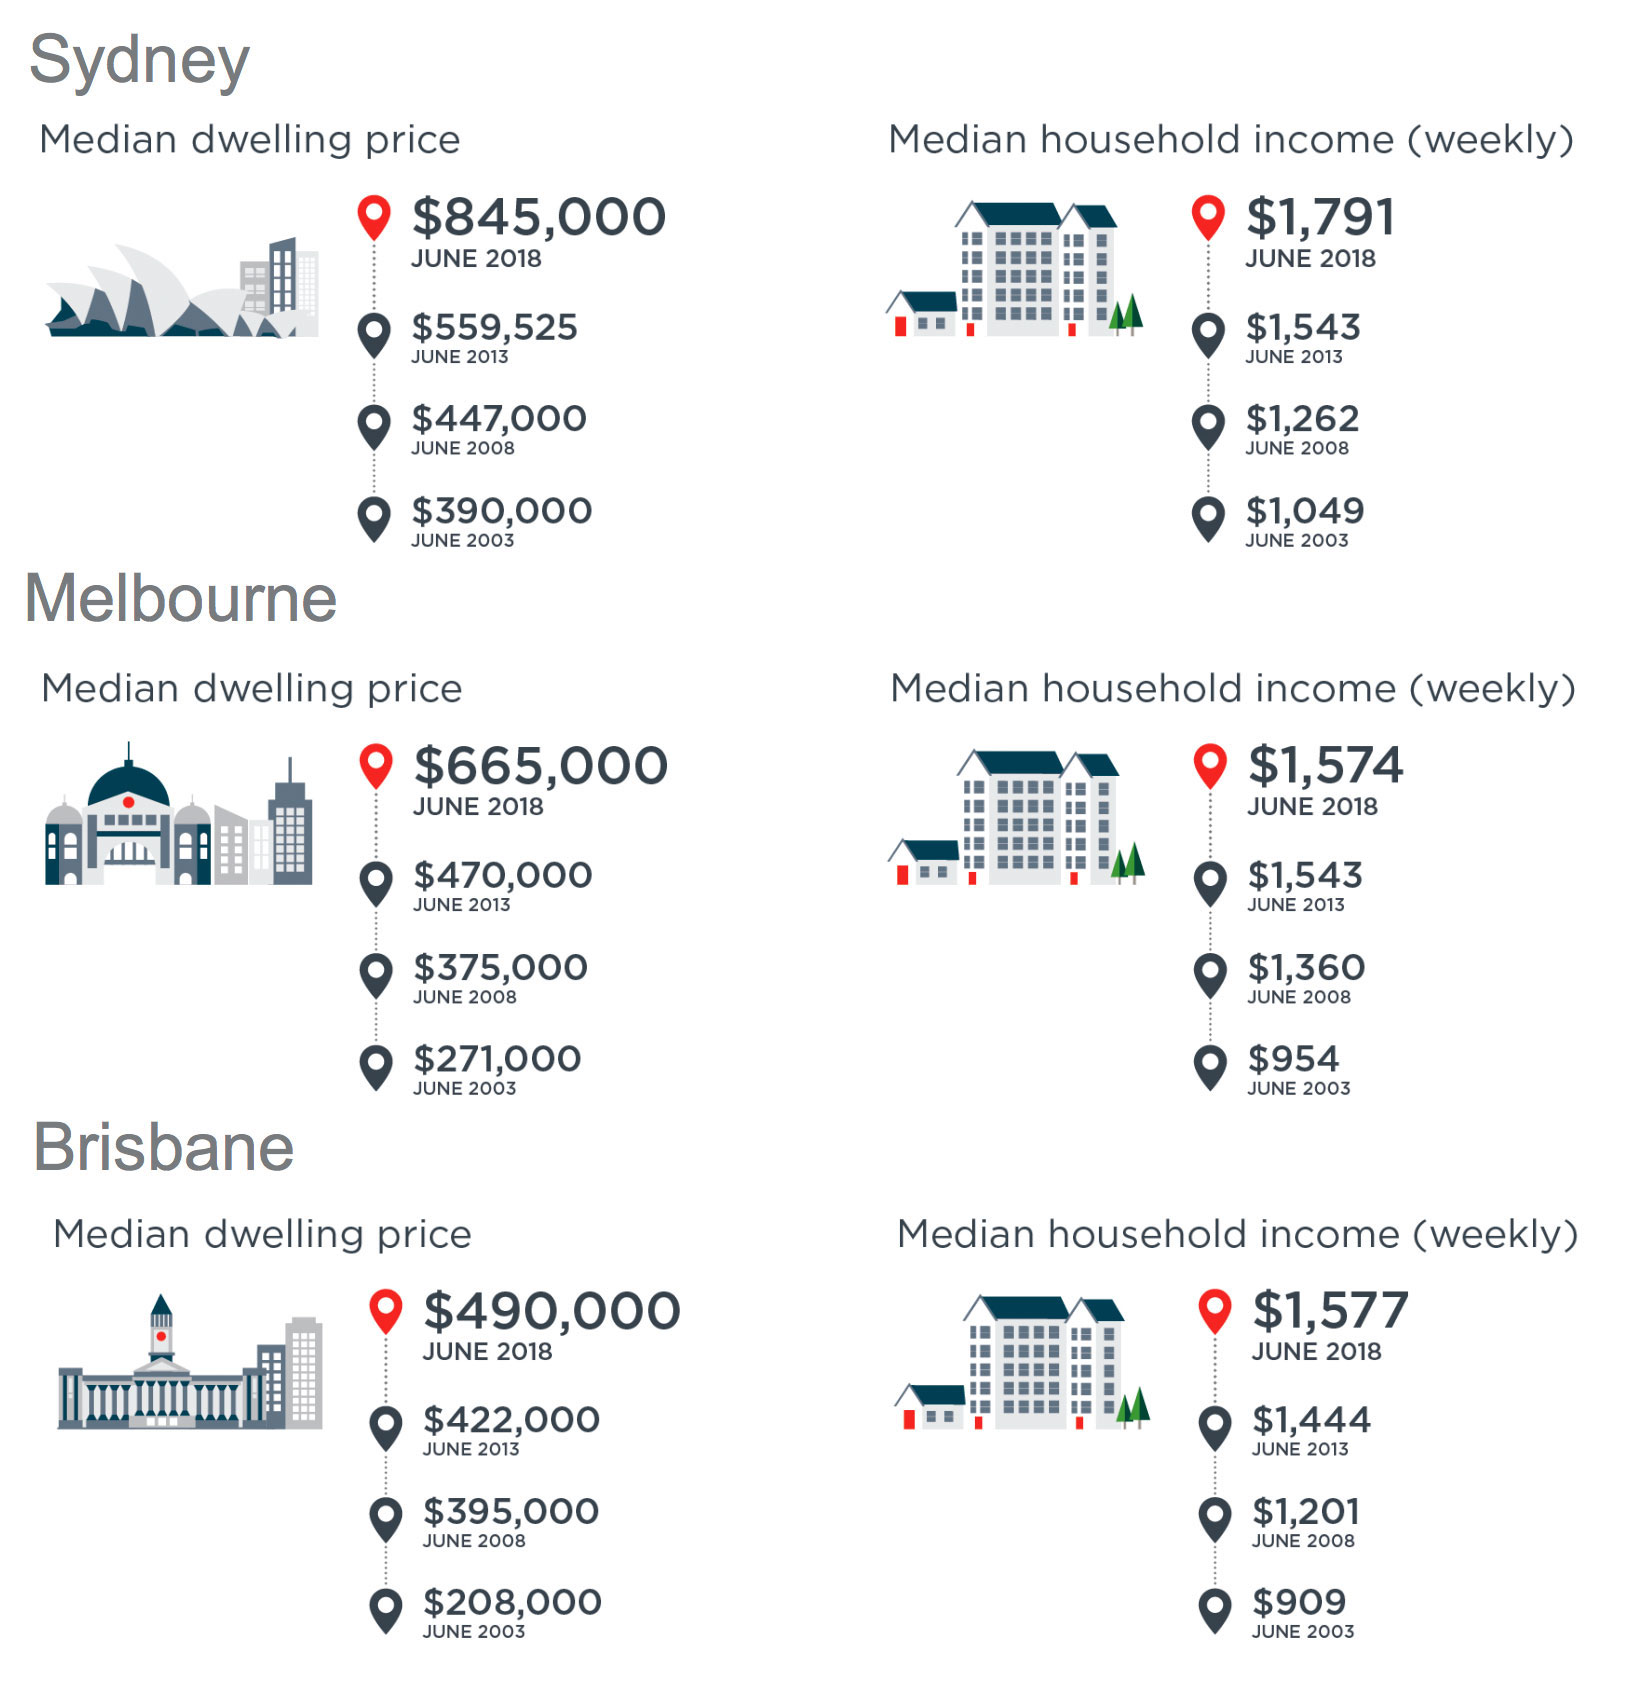
The past ten years has seen worsening housing affordability fuelled primarily by booming property prices across Sydney, Melbourne, regional NSW and most recently Hobart.
Related: Big Four Banks Join Westpac in Raising Home Interest Loans

How many years does it take to save for a 20% deposit?
Based on households saving 15 per cent of their gross annual income, it currently takes 9.1 years for the typical household to save a 20 per cent deposit for a dwelling in Australia.
With detached houses generally being more expensive, the wait is longer – 9.4 years compared with 8.3 years for a unit.
“Those saving hard for a 20 per cent deposit may take solace in the fact that the national average is now 9.1 years for the typical household,” Corelogic head of research Tim Lawless said.
“Five years ago, it took just 8.5 years to save a 20 per cent house deposit and 8.3 years for a unit.
“A decade ago it took 8.8 years and 8.2 years respectively.”
Share of income required for repayments
As at June 2018, the repayment on an 80 per cent LVR mortgage required 46.3 per cent of gross household income – a significantly lower proportion compared with ten years ago when households were dedicated an average 51 per cent of their incomes towards servicing a mortgage.
“[This measure] shows improvement,” Lawless said.
“This servicing reduction is partly because discounted variable mortgage rates have almost halved over the past ten years (from 8.85% in June 2008 to 4.50% in June 2018).
“At its peak a decade ago, a repayment on a house required 52.4 per cent of household income and a unit required 48.7 per cent of household income.”

Proportion of income required to pay rent
Despite the national dream of home ownership, it is still cheaper to rent than repay a mortgage, with house and unit rents currently at 26.9 per cent of the average gross household income.
“In fact, stronger income growth relative to rents has pushed the national ‘rent to income ratio’ to its lowest level since September 2007,” Lawless said.
“Even at their peak, rents required less than 30 per cent of gross household income.
The relatively healthy rent to household income ratio can be attributed to the low rate of rental price appreciation: national weekly rents have risen only 2.9 per cent per annum over the past ten years, while household incomes have tracked 3.1 per cent higher per annum over the same period.
Hobart remains the most unaffordable rental market, with rents rising by 10 per cent while household incomes were only 2 per cent higher over the year. At the other end of the rental housing affordability spectrum is Darwin, where rents have experienced significant falls over recent years while household incomes are up.


