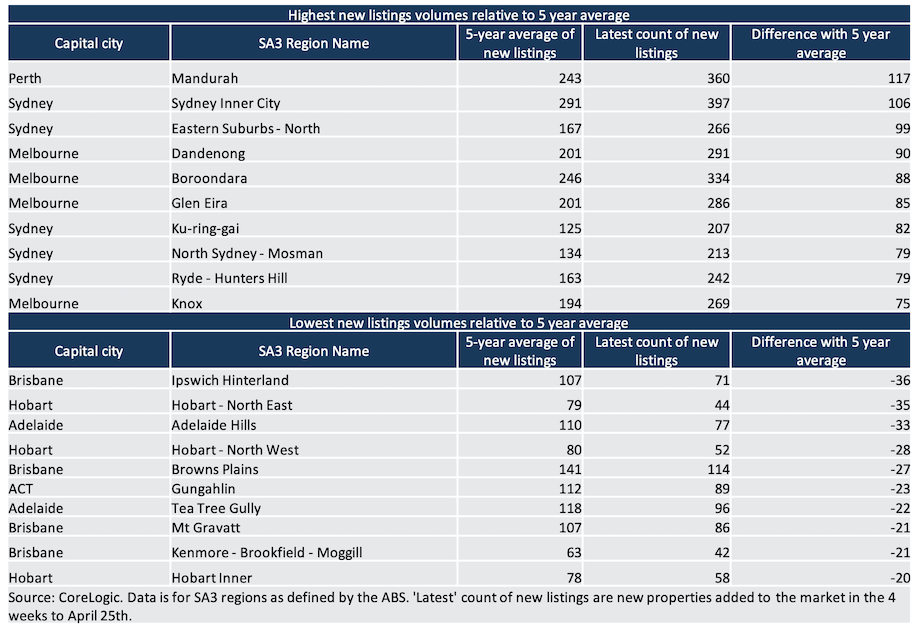
The biggest uplifts in properties for sale relative to the previous five-year average has been dominated by Sydney and Melbourne.
Looking at the uplift in new listings compared to the 12-month change in dwelling values across each SA3 market, it seems that an uplift in new listings volumes are, albeit weakly, correlated with a decline in values.
However, the highest volume of new stock added to the market was seen across Mandurah in Perth, which has seen some of the strongest dwelling value growth in the past 12 months.
The Mandurah market has likely seen a strong uplift in listings because buyer activity has been extremely strong across the region.
Total stock in Mandurah is still more than 900 listings lower than the five-year average, and values across Mandurah are 8.7% higher over the year. It is worth noting however that Mandurah dwellings are still—19.5 per cent below their record high in 2010.
Despite the recent uplift in properties advertised for sale, Mandurah is still a sellers’ market, with a rise in fresh listing numbers coming off a low base.
While additional supply is good news for some buyers, parts of smaller capital cities like Adelaide, Brisbane and Hobart show a different dynamic.
The number of new listings across the whole of Hobart in the past 28 days was just 243 dwellings, which is similar to the volume brought to market amid strict social distancing restrictions around the same time last year.
Such tight advertised supply could create an increased sense of urgency among buyers, leading to further upwards pressure on prices an d greater affordability pressures across these cities.
While a fall in listings can also be a vendor reaction to a lack of buyer activity, most regions still show evidence of high demand.
Furthermore, total listings numbers generally remain very low. Total listings are the count of all new and re-listed properties available for sale.
At the combined capital cities level, total listings are trending -17.1 per cent below the five-year average, even as new stock has been rising.
This is due to rapid absorption from high sales volumes. Total listings volumes could start to rise in the coming months, particularly if come buyers are deterred by a lack of affordability during the coming year.