Resources
Newsletter
Stay up to date and with the latest news, projects, deals and features.
Subscribe
The number of non-residential cranes at work across Australia has hit a new peak as the volume of infrastructure projects makes its mark on the construction sector.
According to the 25th edition of the RLB Crane Index, there were 370 cranes on non-residential projects during the third quarter of 2024.
Rider Levett Bucknall Oceania director of research and development Domenic Schiafone said construction crane numbers had remained strong across Australia led by Sydney, Melbourne and the Gold Coast.
“The Australian construction industry remains buoyant with 863 cranes on sites nationally,” he said.
The Third Quarter 2024 RLB Crane Index recorded the third highest count in the 25 editions of the index, which had recorded more than 800 cranes nationally for the past six editions, Schiafone said.
The large number of cranes correlates with national construction activity, RLB said.
According to the Australian Bureau of Statistics, construction activity within Australia was up 2.2 per cent (or $3.3 billion) in the first six months of 2024 compared to the same period last year.
Residential activity across the country was down slightly for the first six months of 2024 compared to the corresponding period in 2023.
Sydney continued to be the main driver of crane activity.
Of the 863 cranes sighted across Australia, 387 were in Sydney, 196 were in Melbourne, 66 were in Brisbane and 62 on the Gold Coast, which was a record for the Glitter Strip, RLB said.
New South Wales accounted for 49.5 per cent of all cranes across Australia; Melbourne for 22.8 per cent; and South-East Queensland for 16.5 per cent.
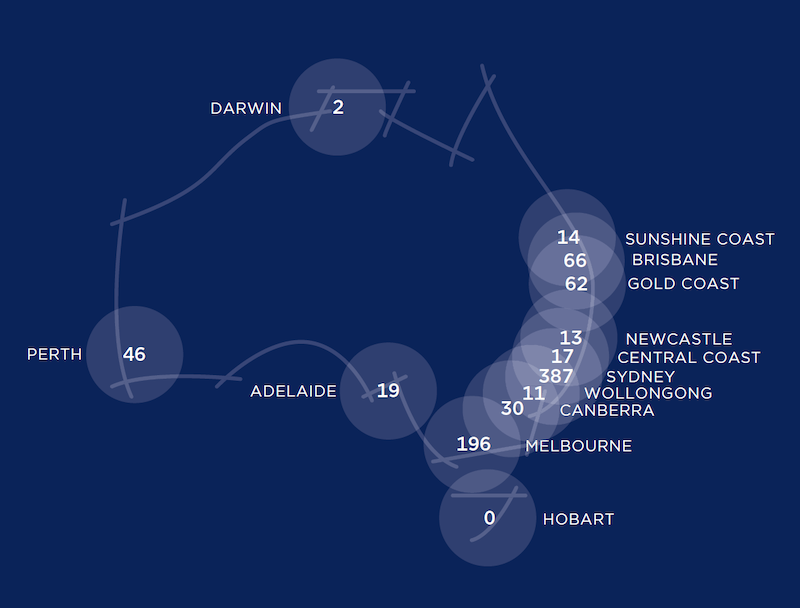
The gap between Sydney and Melbourne crane numbers continued to be significant at 191 cranes, with Sydney hosting 387 cranes and Melbourne 196.
Despite a slight dip to 863 cranes from 882 cranes six months ago, crane numbers across the country remain high.
In the past six months, 257 new cranes were added to new projects, and 263 cranes were removed from projects nearing completion.
Non-residential activity slightly exceeded 2023 results with the civil and engineering sector continuing its substantial growth.
In the 2023 calendar year, engineering activity grew by 16 per cent and has continued to grow by 6 per cent for the first six months of 2024.
There are 370 cranes on non-residential sites, an increase of 36 cranes during the past six months, while there are currently 493 residential cranes on sites around the county (57 per cent of all cranes), down from 535 in the last count.
Just 134 cranes were added to residential projects, and 176 removed from sites.
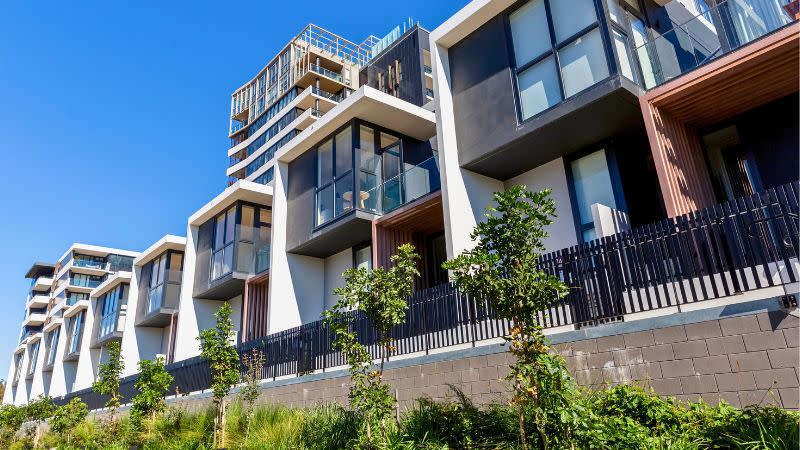
The number of new homes being built has fallen again, down 1.1 per cent for the past quarter, driven by a slump in apartments starts.
According to data from the ABS, the total number of homes begun in the June quarter was 3.6 per cent lower than the same period last year.
The number of homes other than houses (apartments, townhouses and the like) begun was down 7.4 per cent for the quarter compared with the previous quarter, and 12.3 per cent lower than a year ago.
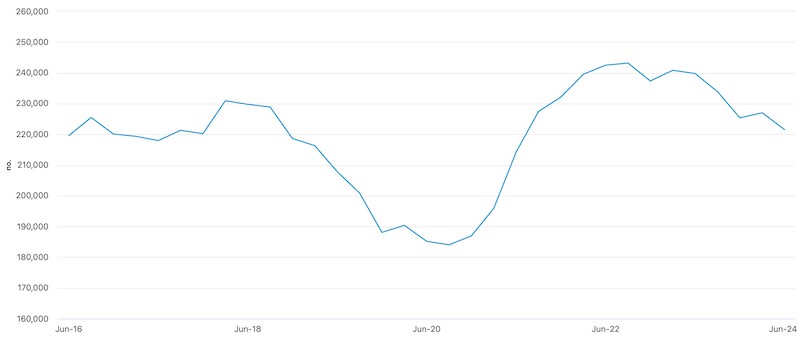
The number of homes under construction last quarter stood at 221,533, compared to 227,008 in the March quarter, which was an uptick on the December, 2023 total of 225,366.
Of the homes under construction last quarter, 88,235 were new houses.
The number of homes completed rose across the quarter. Total homes finished was up 7.3 per cent on the previous quarter and 9.2 per cent up for the year.
Houses completions were up 11.4 per cent for the quarter, while apartments were up 0.4 per cent.
The value of total building work done fell 0.2 per cent to $34 billion in the June quarter, in seasonally adjusted terms.
The decrease was driven by new residential building, which fell 0.4 per cent to $17.1 billion, and followed an increase of 0.6 per cent in the March quarter.
Work done on non-residential building fell 0.2 per cent to $14.1 billion and is 0.4 per cent higher for the year. Work done on alterations and additions to residential buildings rose 0.6 per cent to $2.8 billion.
The Master Builders Australia said the data revealed that 2023-24 was the worst year for home building in more than a decade, dropping 8.8 per cent to 158,690 new starts.
Master Builders chief economist Shane Garrett said that if building continued at this pace, “we’ll be in for less than 800,000 new home starts over the next five years”.
“This would mean a shortfall of over 400,000 homes compared with the National Housing Accord target,” Garrett said.
Tim Lowe, Lowe Living and Lowe Capital founder and co-managing director, said supply constraints continued to be a significant issue, particularly concerning off-the-plan (OTP) sales.
“The overall market sentiment and confidence in securing these sales is low, further exacerbated by a lack of government incentives, such as stamp duty concessions, which pose a barrier to potential buyers,” he told The Urban Developer.
“We’re still facing a substantial planning backlog, and the average time to deliver projects from acquisition to settlement has increased by 25 per cent.
“While construction pricing has stabilised, it has not decreased, making it challenging to navigate historical projects.
“New developments may benefit from speculative revenue increases, but the challenges of selling at higher prices affect sales velocity and increase holding costs for developers.”
Property Council group executive policy and advocacy Matthew Kandelaars said Australia needed to build its way out of the housing crisis, and while it was good to see more homes being completed, there were still not enough being built.
“These numbers serve as a reminder of the tough road ahead and that we need to do everything, everywhere, all at once to boost housing supply,” Kandelaars said.
Geoff County, general manager of SHAPE Homes, part of the ID_CORP group alongside ID_Land, Next Living and Title Capital, said the increase in starts across private sector houses highlighted that “there are still motivated buyers out there who are willing to commence works across new builds”.
“While it’s a good sign ... there’s still a long way to go in terms of recovery, confidence, and activity across the industry.”
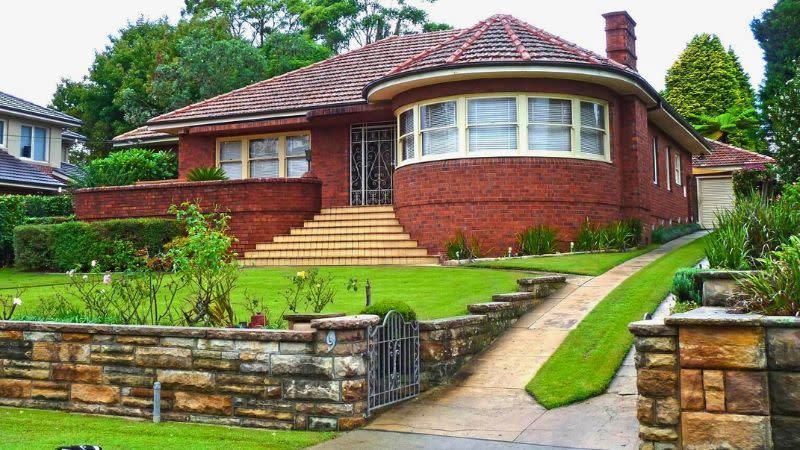
Meanwhile, new listings on realestate.com.au rose 2.8 per cent in September and 10.1 per cent annually, with year-on-year increases in new listings recorded in 12 of the past 14 months, according to PropTrack.
This was the strongest month for national new listings since February 2024, and the highest volume of new listings for a September since 2015.
The combined capital cities (13.7 per cent) and regional markets (4.4 per cent) recorded annual increases in new listing volumes.
Capital cities had the strongest September for new listings since 2015, and regional markets since 2017.
The lift in new listings gave buyers more choice in September, PropTrack said, with total listings over the year 7.7 per cent higher in capital cities and up 5.2 per cent in regional markets.