ResidentialEliza OwenFri 04 Jun 21
Which Suburbs Are Better for Buyers?
One of the factors cementing the current “sellers’ market” conditions in Australian housing is a low level of available stock for sale.
Recent strong price increases have in part been driven by demand for housing outstripping supply.
Corelogic estimates that in the three months to May, around 164,000 dwelling transactions took place in Australia.
Meanwhile, just 136,000 new properties were added to the market for sale in the same period.
While this new listings figure is higher than the previous five-year average (which is closer to 126,000), the uplift in sales volumes means that this stock is quickly absorbed
New listings added for sale, vs sales volumes
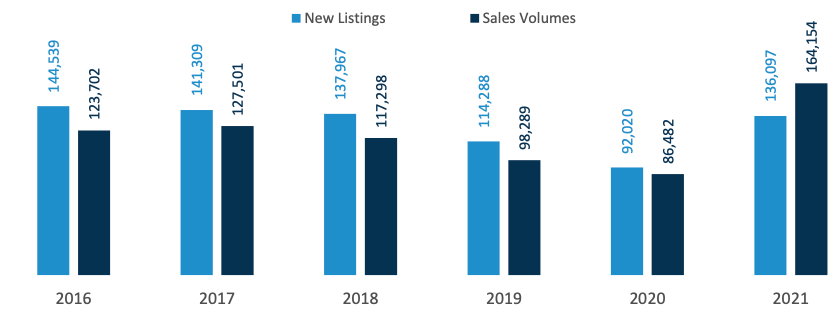
^Source: Corelogic, three months to May - Australia Wide
So where do buyers find reprieve?
Corelogic has analysed suburb-level listings data to understand where there may be more stock available than in previous years, and dwelling value increases have not surged as much as in surrounding suburbs.
The analysis was done using the total level of stock on market as counted in May, between 2016 and 2021 across Australian suburbs.
Corelogic highlights top suburbs within each state where stock on market has increased relative to the five-year average for May, and annual suburb dwelling value increases are less than the wider SA4 region over the past 12 months.
The results are presented in the table below.
The table features 33 suburbs across Australia. While each of these suburbs has seen ‘weaker’ dwelling value increases in the past 12 months relative the broader SA4 regions, only five of these suburbs have actually seen a decline in dwelling values year-on- year.
Many of the suburbs featured are characterised by inner-city or high density urban locations, where housing demand has been softer through Covid-19.
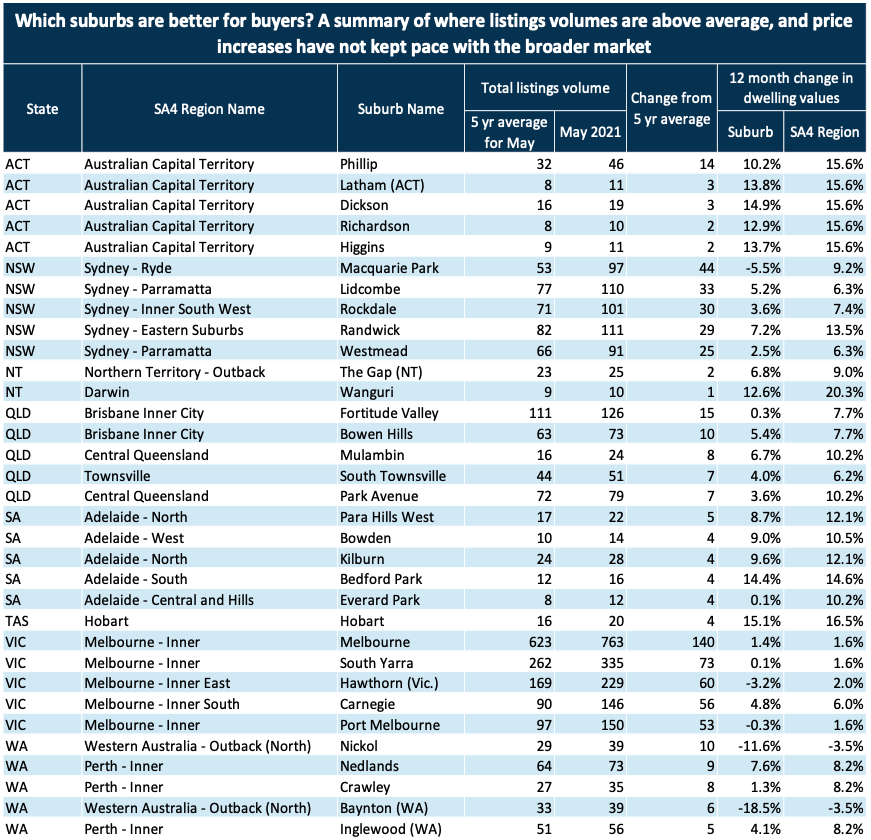
^Source: Corelogic
This may in part be due to a preference for detached housing stock. CoreLogic data suggests that in the year to May, national house values have increased 12.4 per cent compared to a softer 4.8 per cent rise in unit values.
This trend has emerged as investor demand remained relatively subdued in the past 12 months, and owner occupier preferences may have been influenced by spending more time at home through periods of strict social distancing.
Another factor leading to more subdued growth and elevated stock in these markets could be closed international borders.
Decline in demand for inner-city and high urban density housing has occurred across suburbs usually popular with overseas migrants and international students like Melbourne, South Yarra, Westmead and Randwick.
In addition to this, supply in many of the suburbs featured is being supported by new developments, such as in Hawthorn, Phillip and Macquarie Park.
Other suburbs featured include more remote, regional markets such as South Townsville, Mulambin and Nickol.
While buyers would find it easier to secure detached dwellings across these markets, they are quite remote, and may only appeal to buyers with more niche preferences.
CoreLogic analysed around 6000 suburbs, and found that only 938 had total listing volumes that were higher than the five-year average in May.
Of these, only 310 saw dwelling value increases that were slower than the broader SA4 market.
This second data point around growth rates are important when considering buying conditions, because high listings volumes can indicate a short term uplift in supply off the back of strong price increases.
Overall, the data highlights a fairly intuitive sense of Australia’s housing market.
There are slim pickings when it comes to favourable buying conditions.
Buyers willing to purchase more remote regional housing, or in higher density metropolitan areas, will have greater choice of stock.


