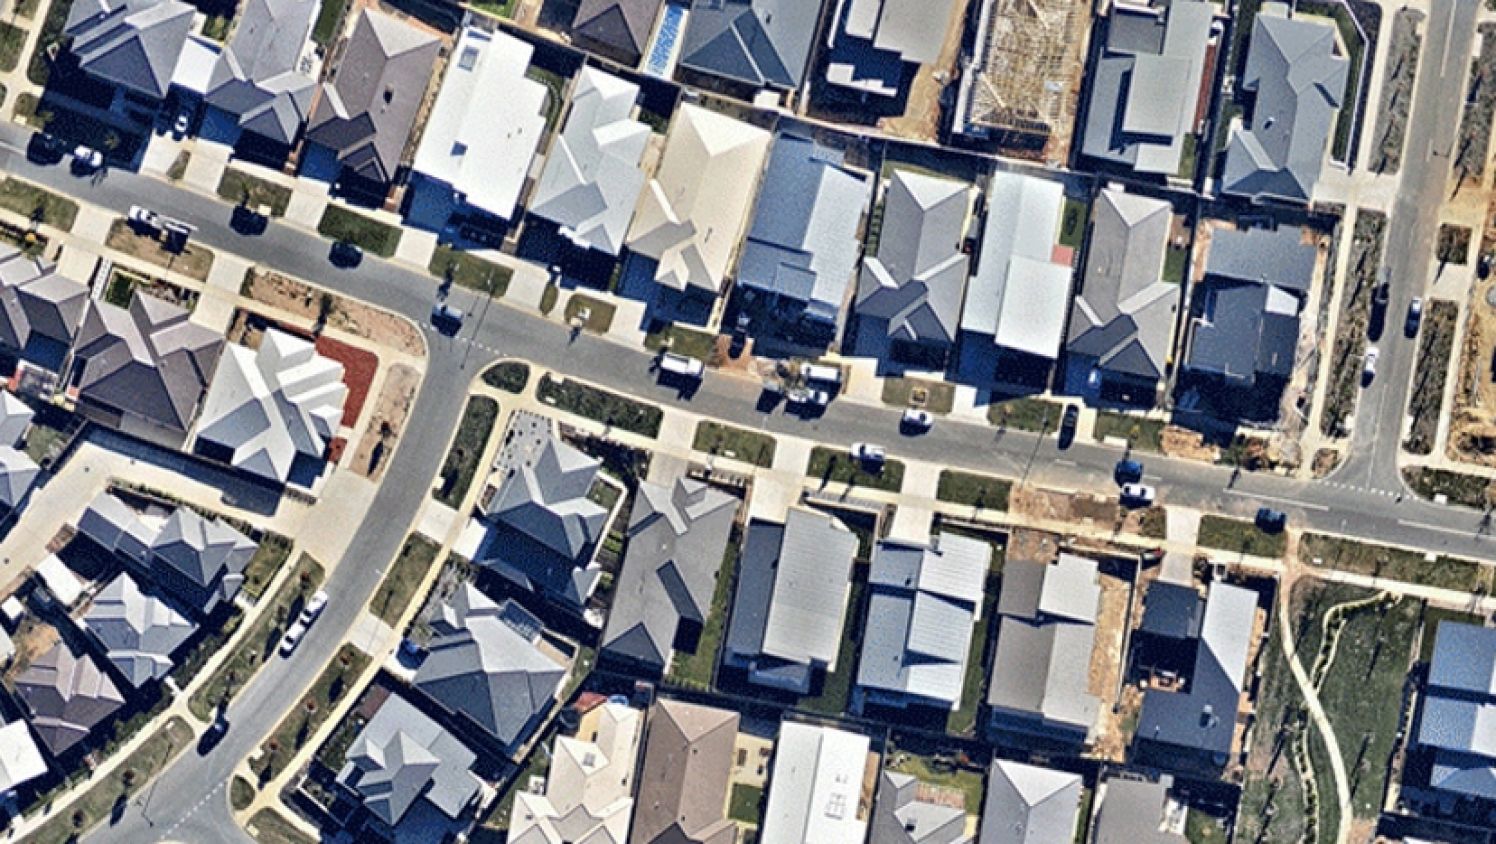
Suburbs Where Property Prices Have Trebled
Despite home prices declining in Australia's two biggest cities over the last 18 months, historical data has revealed that median house prices in 111 Australian locations have trebled or better over the past 20 years.
Following the surprise re-election of a Coalition government, APRA's proposal to scrap the 7 per cent mortgage serviceability rate required of borrowers and the first rate cut since August 2016, there has been a noticeable change in sentiment in the last month across the property industry and markets.
Property vendors during the downturn have been gripped with FONGO (fear of not getting out), moving to offload their properties before prices fell even further, replacing the FOMO (fear of missing out) for buyers that had driven values upwards over the years.
Longstanding property owners in some of Australia's toughest property markets, who have been lucky enough to avoid purchasing at the top of a cycle, have potentially experienced continued growth.

New analysis from research firm Propertyology has plotted two decades of property price movements with several years of very strong gains staring around 2012 pushing property prices and propelling homeowners in a number of Australian suburbs.
Analysts observed more than 180 Australian towns and cities, with a population of 10,000 people or more, over the 20-years ending December 2018.
“Whether someone purchased real estate in any of our eight capital cities twenty years ago or in a majority of Australia’s non-capital locations, today it’s worth at least three times what you paid for it,” Propertyology head of research Simon Pressley said.
“I don’t know about anyone else, but an average annual capital growth rate of circa six per cent across 20 years sounds damn good to me, especially at a time when Australia’s two largest cities have dropped 10 per cent in value in the past 12 months.”
New South Wales
| Suburb | Annual Capital Growth (20yr Average) | Rental Yield | Total Return |
|---|---|---|---|
| Bryon (median $987,500) | 10.1% | 3.7% | 13.8% |
| Parramatta (median $1,190,000) | 7.9% | 2.5% | 10.4% |
| Hawkesbury (median $770,000) | 7.8% | 3.0% | 10.8% |
| Maitland (median $470,000) | 8.2% | 4.5% | 12.7% |
| Parkes (median $245,000) | 6.5% | 6.2% | 12.7% |
Queensland
| Suburb | Annual Capital Growth (20y average) | Rental Yield | Rental Yield Total Return |
|---|---|---|---|
| Southern Downs (median $280,000) | 6.5% | 5.1% | 11.6% |
| Brisbane City (median $680,000) | 7.5% | 3.6% | 11.1% |
| Logan (median $425,000) | 6.8% | 4.7% | 11.5% |
| Sunshine Coast (median $600,000) | 7.1% | 4.3% | 11.4% |
| Scenic Rim (median $470,000) | 6.8% | 4.3% | 11.1% |
Victoria
| Suburb | Annual Capital Growth (20y average) | Rental Yield | Total Return |
|---|---|---|---|
| Bass Coast (median $449,000) | 9.4% | 3.8% | 13.2% |
| Surf Coast (median $835,000) | 9.5% | 3.1% | 12.6% |
| Dandenong (median $685,000) | 9.6% | 3.0% | 12.6% |
| Maribyrnong (median $900,000) | 9.6% | 2.8% | 12.4% |
| Ballarat (median $365,000) | 7.4% | 4.6% | 12.0% |
South Australia
| Suburb | Annual Capital Growth (20y average) | Rental Yield | Total Return |
|---|---|---|---|
| Port Pirie (median $155,000) | 5.8% | 7.2% | 13.0% |
| Port Adelaide (median $445,000) | 8.2% | 4.4% | 12.6% |
| Onkaparinga (median $365,000) | 7.0% | 4.8% | 11.8% |
| Port Lincoln (median $296,000) | 6.4% | 5.3% | 11.7% |
| Mount Barker (median $398,000) | 6.3% | 4.9% | 11.2% |
Tasmania
| Suburb | Annual Capital Growth (20y average) | Rental Yield | Total Return |
|---|---|---|---|
| Derwent Valley (median $255,000) | 7.5% | 6.4% | 13.9% |
| Glenorchy (median $390,000) | 8.4% | 5.2% | 13.6% |
| Burnie (median $245,000) | 6.5% | 5.7% | 12.2% |
| Launceston (median $320,000) | 7.3% | 5.4% | 12.7% |
| Hobart City (median $700,000) | 9.0% | 4.1% | 13.1% |
Western Australia
| Suburb | Annual Capital Growth (20y average) | Rental Yield | Total Return |
|---|---|---|---|
| Kwinana (median $325,000) | 7.8% | 5.1% | 12.9% |
| Armadale (median $382,000) | 7.6% | 4.4% | 12.0% |
| Mandurah (median $365,000) | 6.4% | 4.7% | 11.1% |
| Busselton (median $510,000) | 6.8% | 4.1% | 10.9% |
| Fremantle (median $705,000) | 6.6% | 3.7% | 10.3% |
Median house prices in Sydney two decades ago were among the most expensive in the country at about $220,000. Sydney's median house price is now just under $870,000.
“Anyone who bought in a major regional location back then would have paid a fraction of that price and achieved a similar growth rate over the same period,” Pressley said.
Analysts found that median house price of 103 regional cities and towns trebled in price over the past 20 years.
“The research clearly shows that regional real estate has just as much potential as capital cities, which is why smart investors make an objective assessment of every location in Australia before buying.”
According to Propertyology, Australia’s most expensive city to purchase a house is now Byron Bay in northern New South Wales, with its median house price increasing by a whopping 64 per cent over the past five calendar years.
A recent nationwide analysis showed the median Byron house price was more than $987,500, putting it ahead of Sydney, at $950,000, while Melbourne ranks sixth at about $772,000.
“Generally speaking, locations with a more affordable median house price have more upside potential for capital growth. For that potential to be realised, the real skill is being able to identify the locations with positive leading economic indicators,” Pressley said.


