ResidentialAndrew StoneFri 17 Apr 20
Melbourne’s House Prices and Unemployment: A Look Back
Employment is on all our minds as the Covid-19 crisis unfolds.
While the latest ABS figures don’t show it, the expectation from Treasury and government is that unemployment in Australia will double in coming weeks to more than 10 per cent.
How exactly this will impact residential house prices is not yet clear, with Commonwealth Bank economists the latest to forecast a more than 10 per cent fall in house prices.
Economist Gareth Aird said on Friday that the bank now expects Melbourne house prices to fall 11 per cent.
Headline job numbers show a small increase in the unemployment rate to 5.2 per cent, with the data compiled for the first half of March.
The below graph shows the long-term trends of unemployment in Australia (red line) and house price changes in Melbourne (grey bars).
Related: Stimulus Not Enough to Offset House Price Falls: UBS
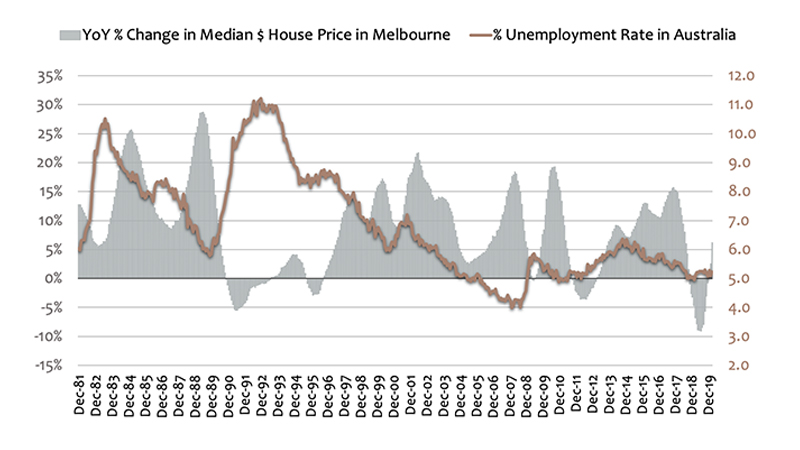
The first, most obvious, insight: sharp increases in unemployment have occurred in the past—in the early 1980s and 1990s, and to a lesser extent, in the early 2000s, and 2008.
The second: while unemployment can rise dramatically in a short space of time, it often takes years to stabilise and fall.
The third, and most interesting insight has to do with the relationship between unemployment and house prices: The level of unemployment is clearly important, but the direction that unemployment is headed is equally – if not more – important to how house prices change.
Unemployment was high through much of the 1980s and mid-to-late 1990s, but house prices boomed. And, notice the changes in price growth where blips of unemployment have occurred.
In each of the long periods of consistent house price growth, unemployment was mainly on a downward trajectory.
Mark Twain’s saying “history doesn’t repeat itself, but it often rhymes” is a truism that most analysts appreciate. A detailed look at past crises can help us make better sense of current circumstances.
The global financial crisis was the last economic crisis in Australia, but it pales in comparison to what we’re living through now.
Below is a graph focused on the economic crises of the late 1980s and early 1990s.
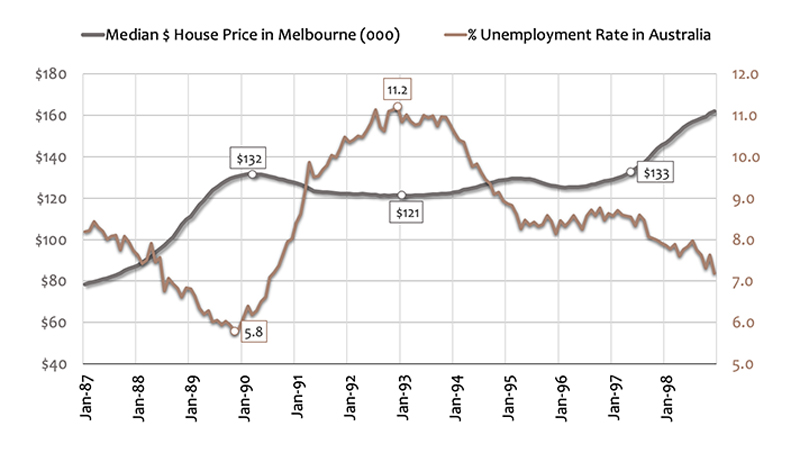
Asset bubbles had built up leading into 1990. Inflation was very high, as were interest rates, and unemployment nearly doubled in 3 years, up 5.4 per cent.
Notice how tight the relationship between unemployment and house prices is. House Prices began falling immediately after unemployment started rising, and they bottomed out at almost the exact time that unemployment peaked.
Three further insights. First, the most dramatic changes occurred in the first 18 months, where Unemployment jumped 4 per cent and house prices fell by 6 per cent.
Second, it took seven years for house prices to fully return to their previous peak, and they only did so once unemployment had fallen, then stabilised. And, finally, look at how quickly prices shot up once unemployment began ticking down consecutively.
What does all this mean for current decision-making? That’s where objective analysis morphs into imperfect opinion and advice.
For now, in this environment where factual evidence is crowded out by biased—but mostly well-meaning—commentary, I’d prefer to just translate the numbers and let people form their own judgements.
Andrew Stone is a director at Property Analytics, a specialist real estate research consultancy based in Melbourne.


