Resources
Newsletter
Stay up to date and with the latest news, projects, deals and features.
Subscribe
Distressed property listings have surged in Victoria as the number of financially strained homeowners outpaces the national average.
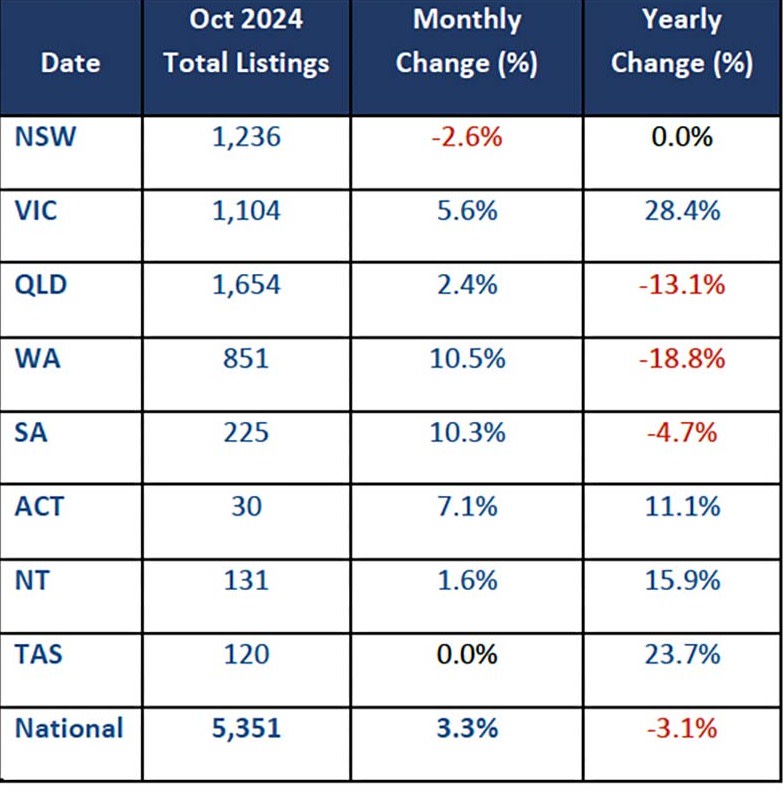
The state has lead the nation with a 5.6 per cent increase for October, well up on the national figure of 3.3 per cent above the figure for the previous month, representing 5351 homes.
SQM Research managing director Louis Christopher said during the past year, Victoria's distressed listings had risen a substantial 28.4 per cent.
Western Australia and South Australia recorded monthly rises of 10.5 per cent and 10.3 per cent respectively while Australian Capital Territory was up 7.1 per cent increase, and the Northern Territory up 1.6 per cent.
Tasmania remained unchanged, and New South Wales distressed listings declined 2.6 per cent.
During the past year, the ACT, NT, and Tasmania recorded increases of 11.1 per cent, 15.9 per cent, and 23.7 per cent respectively.
Queensland, WA, and SA ahd declines of 13.1 per cent, 18.8 per cent, and 4.7 per cent.

Christopher said the counts were still low compared to pre-COVID periods, and that he was “confident listing levels will be up this spring compared to previous years”.
He also said the results “could be an early sign of an increase in the number of Melbourne property owners struggling”.
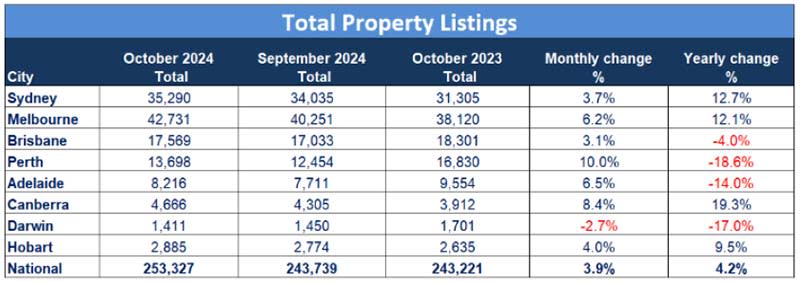
On a positive note, Christopher said, overall residential property listings activity was stronger in October “driven by large increases in Melbourne, Perth, Adelaide and Canberra”.
New property listings experienced an increase of 6.2 per cent, reaching 82,458 homes. This rise in new listings contributed to a 3.9 per cent increase in total residential property listings, which now stand at 253,327 properties nationwide.

The increase in new listings was most pronounced in Hobart, which recorded a 34.5 per cent rise. Perth and Melbourne followed with increases of 14.2 per cent and 13.3 per cent, respectively.
Adelaide experienced a 12.8 per cent rise, while Canberra recorded a 7.6 per cent increase. Darwin and Brisbane had smaller gains of 8.1 per cent and 1.0 per cent, respectively.
Sydney experienced a slight decline, with new listings decreasing by 0.6 per cent.
Year-on-year, national new listings showed a 3.4 per cent increase. Sydney led the annual growth with a 10.0 per cent rise, followed by Brisbane with an 8.6 per cent increase.
Melbourne and Canberra recorded yearly increases of 8.2 per cent and 8.3 per cent, respectively. Darwin had the most significant annual decrease at 22.7 per cent, while Adelaide and Hobart experienced declines of 7.5 per cent and 4.6 per cent, respectively.