House Price Decline Largest in Six Years
Australia's housing downturn gathered momentum in July, with national dwelling values reporting the largest annual fall since August 2012.
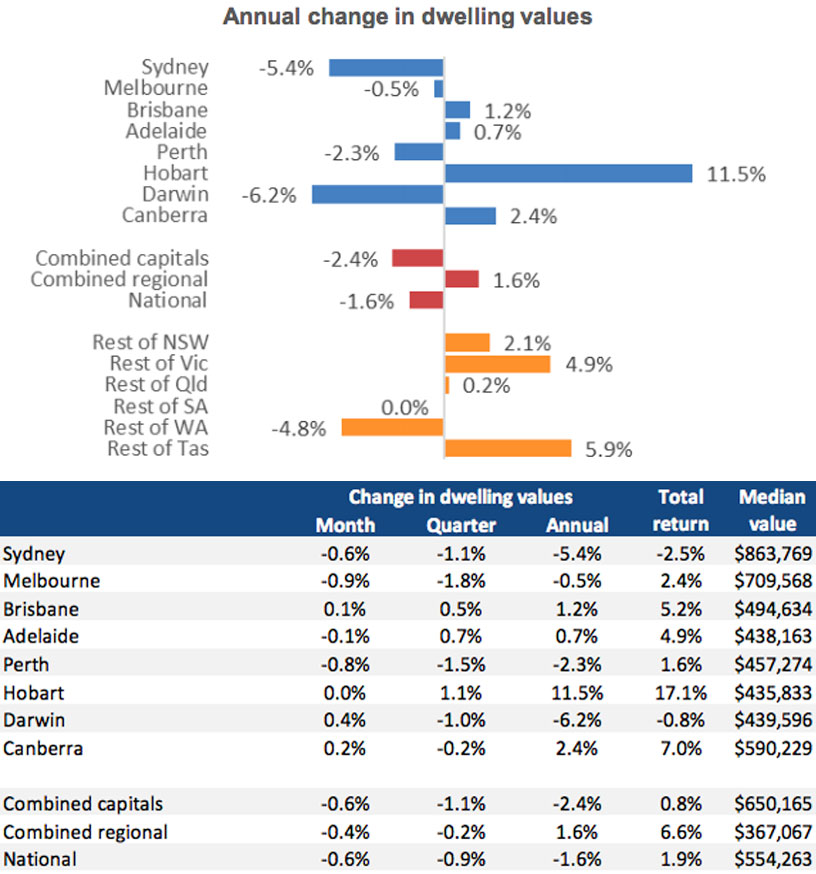
House prices were 1.6 per cent lower than this time last year and slipped 0.6 per cent over the month, according to property research group Corelogic.
Since peaking in September 2017, the housing market has recorded a 1.9 per cent fall in value – still relatively mild given property prices remain 31 per cent higher than five years ago.
Corelogic head of research Tim Lawless said weakness in dwelling values is driven by long-running declines in Perth and Darwin.
"Along with an acceleration in the rate of decline across Sydney and Melbourne and slowing growth rates across most of the remaining regions," Lawless said.
Despite a 2 per cent rise in the rate of new home sales last month, it has been an underwhelming start to the year for the sector, with the housing market recording a cumulative 1.9 per cent fall in value since peaking in September last year.
On a national basis, the 0.6 per cent month-on-month fall was the largest decline since September 2011.
Five of the eight capital cities saw values fall over the past quarter, and trends across Australia's regional housing markets – which have previously been more resilient to falls – have turned negative.
Related: Is Australia’s Residential Market Experiencing a Credit Crunch?

Melbourne leads downturn
Melbourne has lead the downturn across capital cities, outpacing Sydney since May.
"Melbourne dwelling values were down 1.8 per cent over the past three months, followed by Perth (-1.5%) and Sydney (-1.1%)," Lawless said.
"Melbourne’s decline phase commenced five months later than Sydney’s, with the market peaking in November last year."
In Brisbane, the annual rate of growth has eased from 2.9 per cent a year ago to 1.2 per cent.
Adelaide's annual growth rate has also declined, falling from 5.4 per cent a year ago to just over 0.7 per cent over the most recent twelve month period.
"The growth trends vary remarkably across the broad valuation segments of each housing market, highlighting the diversity of conditions," Lawless said.
“The starkest annual performance differential is in Melbourne, where the top quartile has seen values fall 4.1 per cent over the past twelve months while property values across the lower quartile are 7.5 per cent higher.
"In Sydney, dwelling values are down 8.0 per cent across the most expensive quarter of the market, while the most affordable quarter of the market has seen values fall by a much lower 1.8 per cent over the past twelve months.”
Related: Declining Home Ownership Leads to Intergenerational Inequality: HILDA

Building approvals pick up in June
Australian building approvals increased in June in a positive for the building sector according to latest data from the Australian Bureau of Statistics.
In seasonally adjusted terms, total dwellings increased by 6.4 per cent in June a welcomed rise after last month’s 7.4 per cent spiral.
ABS said the June jump was largely driven by a 7.2 per cent increase in private dwellings, excluding houses, with private houses increasing 5 per cent in seasonally adjusted terms.
The number of Building approvals in June was 1.6 per cent higher than in the same month last year.
ABS director of construction statistics Justin Lokhorst said the increase was driven primarily by private dwellings excluding houses, which increased by 1.1 per cent in June.
"This was offset by a 0.6 per cent fall in private sector houses," Lokhorst said.
HIA principal economist Tim Reardon said the increase in building approvals for the end of the financial year makes 2017-18 the third highest year on record for building approvals – after 2014-15 and 2015-16.
“The sustained boom in building activity is unprecedented,” Reardon said.
This week HIA released findings new home sales had increased 2 per cent for the month of June marking a positive after a slow first half to 2018.
Reardon cites the growth in the number of new homes available as a primary reason why house price increases have slowed over the past year.
“The affordability challenge can only be addressed by allowing the industry to grow to meet the demand for new housing. This includes making more residential land available and reducing the taxation burden on new housing.”
Taking into consideration each state and territory for the month of June, ABS stats show dwelling approvals rose in the Australian Capital Territory (5.8%), South Australia (5.6%), Northern Territory (4.8%), Tasmania (2.2%), Western Australia (1.7%) and New South Wales (0.2%).
While Queensland and Victoria experienced falls of 1.6 per cent and 1.2 per cent respectively.


