RetailDinah Lewis BoucherMon 29 Apr 19
Still on Top: NSW, VIC Tie As Nation’s Top Economies
Victoria and New South Wales again share the title of the nation's best-performing economy, with the two states each benefiting from solid population growth and strong job markets, driving retail spending and business investment.
In the second consecutive quarterly survey Victoria and New South Wales share the top spot of best performing economy, amid the nation's slowing housing sector.
The report shows Victoria’s economic activity was 26.9 per cent above its decade-average output, the best result in the nation, and 1.5 percentage points ahead of New South Wales in the December quarter.
“It is very, very clear New South Wales and Victoria are the best performing economies,” CommSec's chief economist Craig James said.
While the ACT's housing strength has ensured its joint ranking in third spot with Tasmania. Australia's capital had the second-largest annual population growth, at 1.93 per cent, behind Victoria at 2.2 per cent.
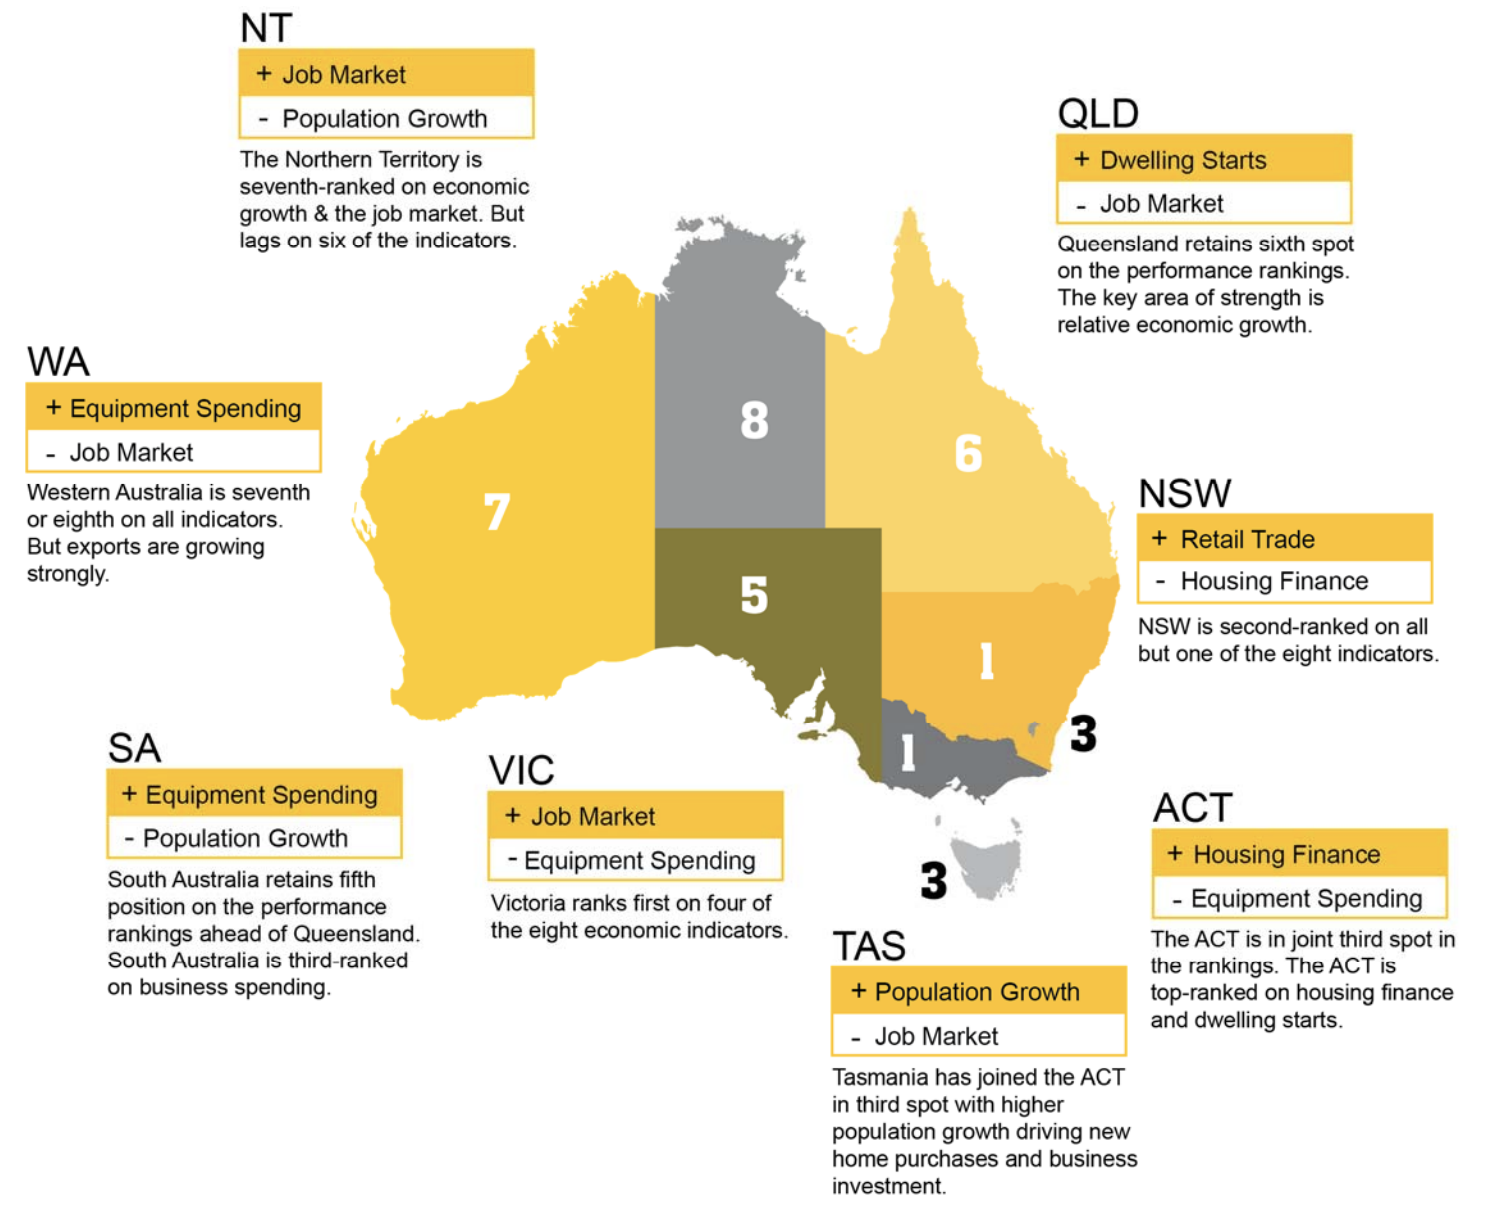
The results are part of CommSec’s quarterly State of the States report which ranks Australia’s states and territories according to eight economic indicators.
The report analyses the current rates of economic growth, retail spending, equipment investment, unemployment, construction work done, population growth, housing finance and dwelling commencements to score each state.
1= Victoria Overview
Victoria ranks first on four of the eight indicators.
The state also recorded the nation’s highest wage growth of 2.7 per cent in the year to December.
Construction work done across the state was 33.1 per cent above the decade average, outperforming the nation.
| Key Categories | Level this quarter | Compared with decade average |
|---|---|---|
| Dwelling commencements | 14,307 | -3.1% |
| Unemployment | 4.6% | -18.7% |
| Population growth | 2.20% | 5.5% |
| Economic growth | $420,563m | 26.9% |
| Equipment investment | $3,169m | 5.2% |
| Housing finance | 14,326 | 5% |
| Retail spending | $20,962m | 17.7% |
| Construction work | $13,615m | 33.1% |
1= New South Wales Overview
Of the key economic indicators considered in the report – including economic growth, retail spending, and unemployment – New South Wales ranked second on all but one of the eight indicators.
The state takes the joint top position with Victoria.
Perhaps unsurprisingly, housing finance is its weakest metric, while the state performed strongly in retail.
Construction activity for the state was 29.1 per cent above the decade-average.
| Key categories | Level this quarter | Compared with decade average |
|---|---|---|
| Dwelling commencements | 16,397 | 30.7 |
| Unemployment | 4.3% | -18.6% |
| Population growth | 1.51% | 7.1% |
| Economic growth | $538,673m | 25.4% |
| Equipment investment | $4,307m | 10.9% |
| Housing finance | 14,204 | -4.9% |
| Retail spending | $25,782m | 15.6% |
| Construction work | $16,255m | 29.1% |
3= ACT Overview
The ACT and Tasmania took joint third position on the economic performance rankings. The ACT is top-ranked on housing finance and dwelling starts.
| Key Categories | Level this quarter | Compared with decade Average |
|---|---|---|
| Dwelling commencements | 1,958 | 66.6% |
| Unemployment | 3.6% | -8.7% |
| Population growth | 1.93% | 0.9% |
| Economic growth | $51,021m | 20.3% |
| Equipment investment | $114m | 2.7% |
| Housing finance | 1,086 | 17% |
| Retail spending | $1,485m | 14.3% |
| Construction work | $1,017m | 20.9% |
3= Tasmania Overview
Tasmania ranked first on relative population growth and business spending.
The state has edged up the rankings to third equal position.
| Key categories | Level this quarter | Compared with decade Average |
|---|---|---|
| Dwelling commencements | 714 | 11.8% |
| Unemployment | 6.5% | 2.5% |
| Population growth | 1.15% | 99.2% |
| Economic growth | $37,470m | 18.7% |
| Equipment investment | $239m | 27.8% |
| Housing finance | 1,068 | 16.4% |
| Retail spending | $1,618m | 13.5% |
| Construction work | $793m | 22.5% |
5= South Australia
| Key categories | Level this quarter | Compared with decade average |
|---|---|---|
| Dwelling commencements | 2565 | -5.7% |
| Unemployment | 5.9% | -3.3% |
| Population growth | 0.79% | -12% |
| Economic growth | $121,804m | 17.5% |
| Equipment investment | $789m | 9.4% |
| Housing finance | 3,545 | 1.1% |
| Retail spending | $5,227m | 10.5% |
| Construction work | $2,975m | 11.3% |
6= Queensland
Queensland retained sixth position. Its key area of strength is relative economic growth, third-ranked according to the report. But the sunshine state is fourth on dwelling starts, fifth on relative population growth and the job market.
| Key categories | Level this quarter | Compared with decade average |
|---|---|---|
| Dwelling commencements | 9,451 | 1.4% |
| Unemployment | 5.9% | -0.5% |
| Population growth | 1.74% | -0.4% |
| Economic growth | $391,071m | 20.4% |
| Equipment investment | $2,955m | 0.3% |
| Housing finance | 9,078 | -7.4% |
| Retail spending | $15,892m | 9.6% |
| Construction work | $9,796m | -21.3% |
7= Western Australia
Western Australia kept its seventh position on the economic performance rankings, and can be broadly grouped with Northern Territory.
Both economies continue to face challenges with the transition of resource projects moving from the production to the export phase, the report notes.
| Key categories | Level this quarter | Compared with decade average |
|---|---|---|
| Dwelling commencements | 3,762 | -34.6% |
| Unemployment | 6.1% | 17.2% |
| Population growth | 0.88% | -52.1% |
| Economic growth | $314,308m | 13.1% |
| Equipment investment | $2,249m | -9.8% |
| Housing finance | 4,727 | -24.5% |
| Retail spending | $8,443m | 5.5% |
| Construction work | $6,562m | -42.7% |
8= Northern Territory
| Key categories | Level this quarter | Compared with decade average |
|---|---|---|
| Dwelling commencements | 157 | -58.8% |
| Unemployment | 4.4% | 12.2% |
| Population growth | -0.18% | -114.8% |
| Economic growth | $32,005m | 16% |
| Equipment investment | $118m | -35.8% |
| Housing finance | 230 | -32.1% |
| Retail spending | $769m | 1.2% |
| Construction work | $727m | -51% |


