Australian Property Listings Surge in November
Figures released on Melbourne and Sydney’s residential listings reveal significant year-on-year jumps, reflecting the surplus of stock in Australia’s largest cities.
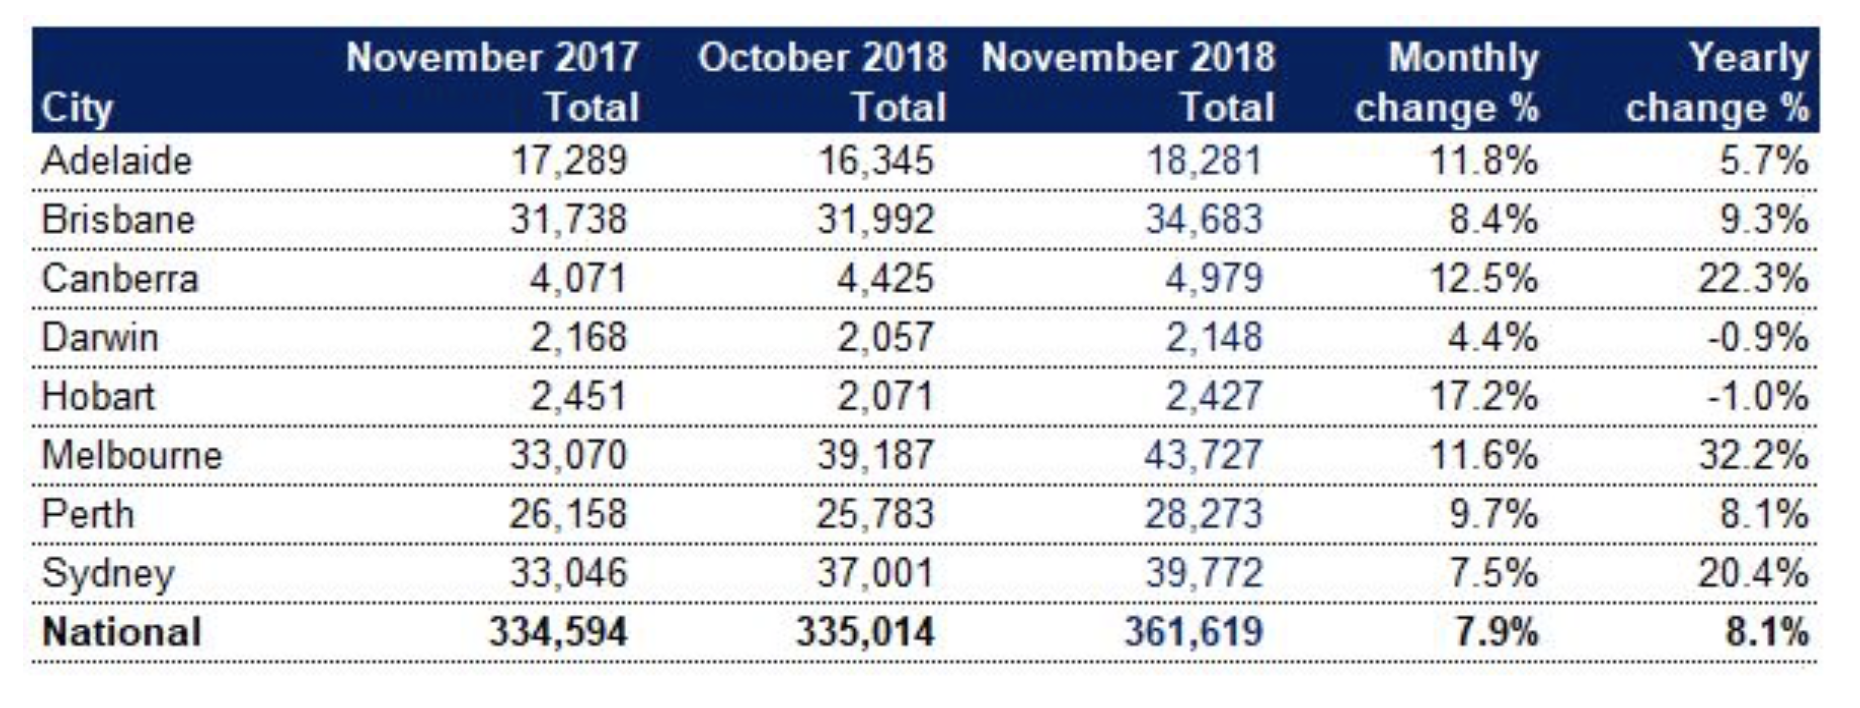
SQM Research reveals national residential listings increased 7.9 per cent in November, an increase from 335,014 in October to 361,619 last month, with stock on market rising in all cities in an expected seasonal uplift.
Melbourne listings jumped by 11.6 per cent, this figure 32.2 per cent higher than a year ago.
While Sydney’s property listings grew by 7.5 per cent for the month reflecting the highest reading since 2009. Sydney listings have increased 20.4 per cent higher than from a year prior.
In Queensland, Brisbane’s listings increased 8.4 per cent for the month, reflecting a yearly increase of 9.3 per cent.
Amid the ongoing property market commentary and reports, SQM Research managing director Louis Christopher says the rise in listings is normal given this time of year.
“November listings usually jump ahead of the market slowing during the Christmas and New Year’s break, so the results are expected,” Christopher said.
“That said, the year-on-year increases in Sydney and Melbourne are large.
“The market in these big cities is now flooded with stock. Vendors who do not price their properties realistically will not sell in this market.
“It has been a particularly bad spring selling season for vendors and agents alike,” he said.
Related: Sydney and Melbourne House Prices Will Fall 20%: ANZ

This week the RBA released its financial aggregates data for October 2018 which also covers the value of outstanding mortgages.
At the end of October this year, the RBA measured $1.797 trillion in outstanding housing credit. Housing was the largest share at 62.1 per cent of total credit.
Owner-occupiers accounted for 67 per cent of outstanding credit while investors represented 33 per cent, the lowest figure since June 2012.
Related: Australian House Prices Fall at Fastest Pace Since GFC: Corelogic

In Hobart, SQM show listings increased a substantial 17.2 per cent, with stock levels down a slight 1 per cent in comparison to a year earlier.
“We are also finally seeing some relief in Hobart, with listings jumping in November, helping to reverse a shortage of properties available for sale,” Christopher said.
Listings increased by 12.5 per cent in Canberra for the month of November while they increased 9.7 per cent in Perth.
Asking prices
Capital city average asking prices for houses dropped to $932,600 while unit asking prices were steady at $569,300 over the month to December, according to SQM.
Asking house prices in Sydney dropped again, by 2.3 per cent to $1.274 million. This price is down 5.2 per cent from a year earlier.
Sydney unit prices fell by one per cent to $696,000.
Melbourne asking house prices increased 0.4 per cent to $963,200, while unit prices were up 0.5 per cent to $555,800.


