Housing Market Wrap Up: Auctions, Approvals and GDP
Regular readers of The Urban Developer will by now be familiar with the turnaround in Australia’s residential market conditions after tentative improvements in house prices and a widely-reported boost in public sentiment.
Australia’s largest housing markets are starting to pick up, with a resurgent Sydney market leading the charge according to monthly house price data.
And while the recovery trend is still in its early days, housing market data and economic figures released over the last week show headwinds may continue to drag the market.
The much-awaited GDP results released on Wednesday showed the slowest rate of growth since the global financial crisis, with GDP growing just 0.5 per cent for the June quarter and 1.4 per cent over the year.
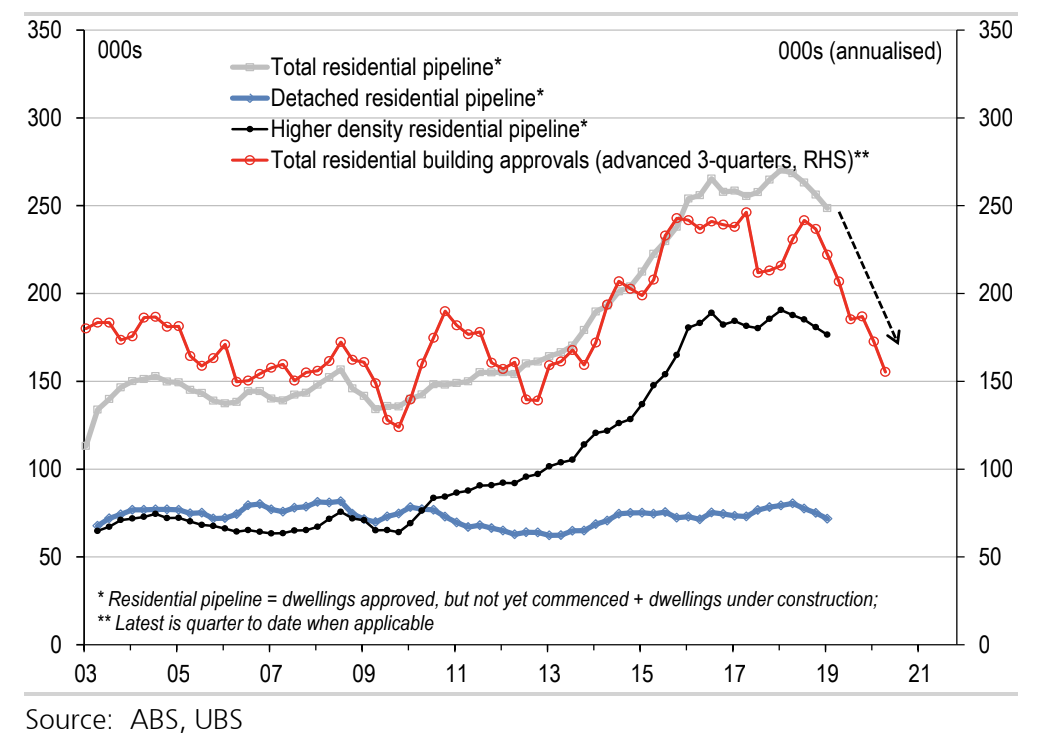
Negative wealth effects from the house price downturn continue to drag on consumer spending, with weak housing and business investment adding to economic woes; while building approvals continue their downward trend.
The official building approval figures point to a downturn that has further to run and will continue to impact credit growth, according to AMP economist Shane Oliver.
“[Building approvals] amount to a 0.5-0.6 percentage point per annum direct detraction from growth. In total the housing downturn is likely to detract around 1-1.2 percentage points from growth in the year ahead.”
Add to that concerns about building quality in the apartment sector and the threat from escalating trade wars—and a v-shaped turnaround in residential markets looks less than likely.
Related: Regulators Positive About Housing Market Recovery
Unless approvals lift soon, the residential building pipeline will fall, seeing housing activity drop: UBS

Monthly residential building activity figures, released by the AI Group and HIA on Friday, show continued contraction in residential construction activity.
The apartment sector was the weakest performing area of activity, declining for the 17th consecutive month, while home building remained in negative territory—albeit at a slower pace of decline.
“The continued fall in activity is bringing with it a further squeeze in margins with selling prices falling while input costs and wages continue to rise,” AI Group head of policy Peter Burn said.
Low property turnover is also a consideration—according to sales data analysis by Corelogic, people are holding on to their homes for much longer than they were 10 to 15 years ago.
The average homeowner now owns their home for 11.3 years, while units are held for an average 9.6 years.
Corelogic analyst Cameron Kusher said that the rising cost of selling and purchasing property, combined with affordability constraints contribute to owners holding onto their properties longer.
“It’s expected that this trend will continue over the coming years given such concerns aren’t likely to see much improvement in the near future,” Kusher said.
And with the Reserve Bank under pressure to cut interest rates further, much depends on the spring selling season.
“As stock levels continue to rise throughout spring, we will get a much better understanding of the depth of the current recovery,” Corelogic research director Tim Lawless said.
“As listing numbers and auction volumes rise, clearance rates may soften if buyer demand doesn’t lift to match the increase in supply.”


