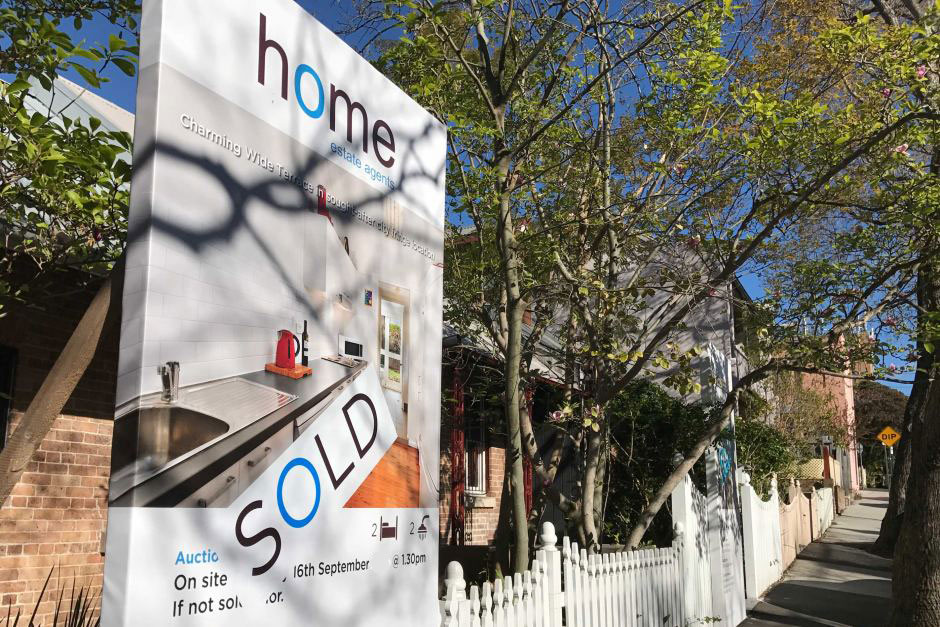
Three Quarters of Properties Sell for Less than Listed Price: Corelogic
Australia's property market continues to slide with Corelogic reporting that over the three months to October 2018, more than three quarters of properties were sold for less than their listed purchase price.
Apprehensive buyers, cautious lenders and retreating investors have resulted in 75.4 per cent of properties listed transacting lower than their original listed purchase price.
A mere 7 per cent of properties sold for their originally listed price while the remaining 17.6 per cent sold for more than the originally listed price.
Melbourne is currently seeing 76.3 per cent of properties selling below the original list price which is the highest share in at least 12 years while 65.7 per cent of properties sold for less than 20 per cent the original list price in Brisbane.
Related: Weak Market Conditions to Impact House Prices: Report
Corelogic Capital City Auction Statistics
| City | Clearance Rate | Total Auctions | Corelogic Auction Results | Cleared Auctions | Uncleared Auctions |
|---|---|---|---|---|---|
| Sydney | 42.1% | 844 | 682 | 287 | 395 |
| Melbourne | 46.2% | 1,127 | 994 | 459 | 535 |
| Brisbane | 33.6% | 139 | 122 | 41 | 81 |
| Adelaide | 46.2% | 123 | 104 | 48 | 56 |
| Perth | 20.7% | 42 | 29 | 6 | 23 |
| Canberra | 40.2% | 108 | 92 | 37 | 55 |
| Hobart | N/A | 3 | 3 | 2 | 1 |
| Weighted Average | 43.3% | 2,386 | 2,026 | 880 | 1,146 |
Sydney remains the hardest hit with 83.3 per cent of properties selling for less than the original list price compared to 13.3 per cent selling above the list 50 per cent price.
Sydney vendors are now discounting asking prices by an average of 7.3 per cent in order to make sale, compared to 5.4 per cent a year ago.
The city's clearance rate also fell to 42.1 per cent from 42.6 per cent in the prior week, the weakest result since December 2008.
Sydney's auction clearance rates could be set to fall further with the prospect of the federal Labor government’s proposed changes to negative gearing and capital gains tax deductions for property investors are enacted.
The last time the cities clearance rates hit the 30 per cent range was November 2008 during the global financial crisis, May 2004, when NSW introduced vendor stamp duty, and July 1989, when the cash rate hit 17 per cent.
Related: Is Australia’s Residential Market Experiencing a Credit Crunch?

Last week saw 2,386 homes taken to auction across the combined capital cities, returning a final auction clearance rate of 43.3 per cent, increasing from the previous week when 42.7 per cent of the 1,541 homes taken to auction were successful.
Nationally, CoreLogic reported that there was an increase in auction volumes over the week with 2,602 homes scheduled to go under the hammer, up from 2,386 over the previous week.
Melbourne accounts for 51 per cent of all auctions this week with just over 1,300 homes scheduled to go under the hammer, increasing from 1,127 last week.
Sydney volumes are sitting at similar levels week-on-week with 845 auctions currently on the radar, compared to 844 last week.
Related: Melbourne House Prices Fell Faster than Sydney Over the Quarter: Domain
While rising mortgage rates, a credit crackdown and a decrease in overseas buyers has seen capital city house prices decrease, opportunistic home buyers could still find themselves priced out of the market with finance commitments declining.
Research recently released by the Australian Bureau of Statistics has revealed the demand for home loans has been gradually falling, with nearly 4 per cent fewer loans issued over September.
This included a 4.2 per cent reduction in the value of loans for owner occupiers and a 2.8 per cent reduction in the value of loans to investors.


